
Cinebench 2024: Reviewing the Benchmark

Maxon’s Cinebench is a perennial benchmark favorite. It’s free, easy to run, and scales across as many cores as you can give it. Its $0 cost allows the internet to provide plenty of results for reference. Consumers and tech reviewers alike therefore heavily use Cinebench when evaluating hardware. Understanding Cinebench’s characteristics will help make sense of its results and how they’re affected by the tested hardware.
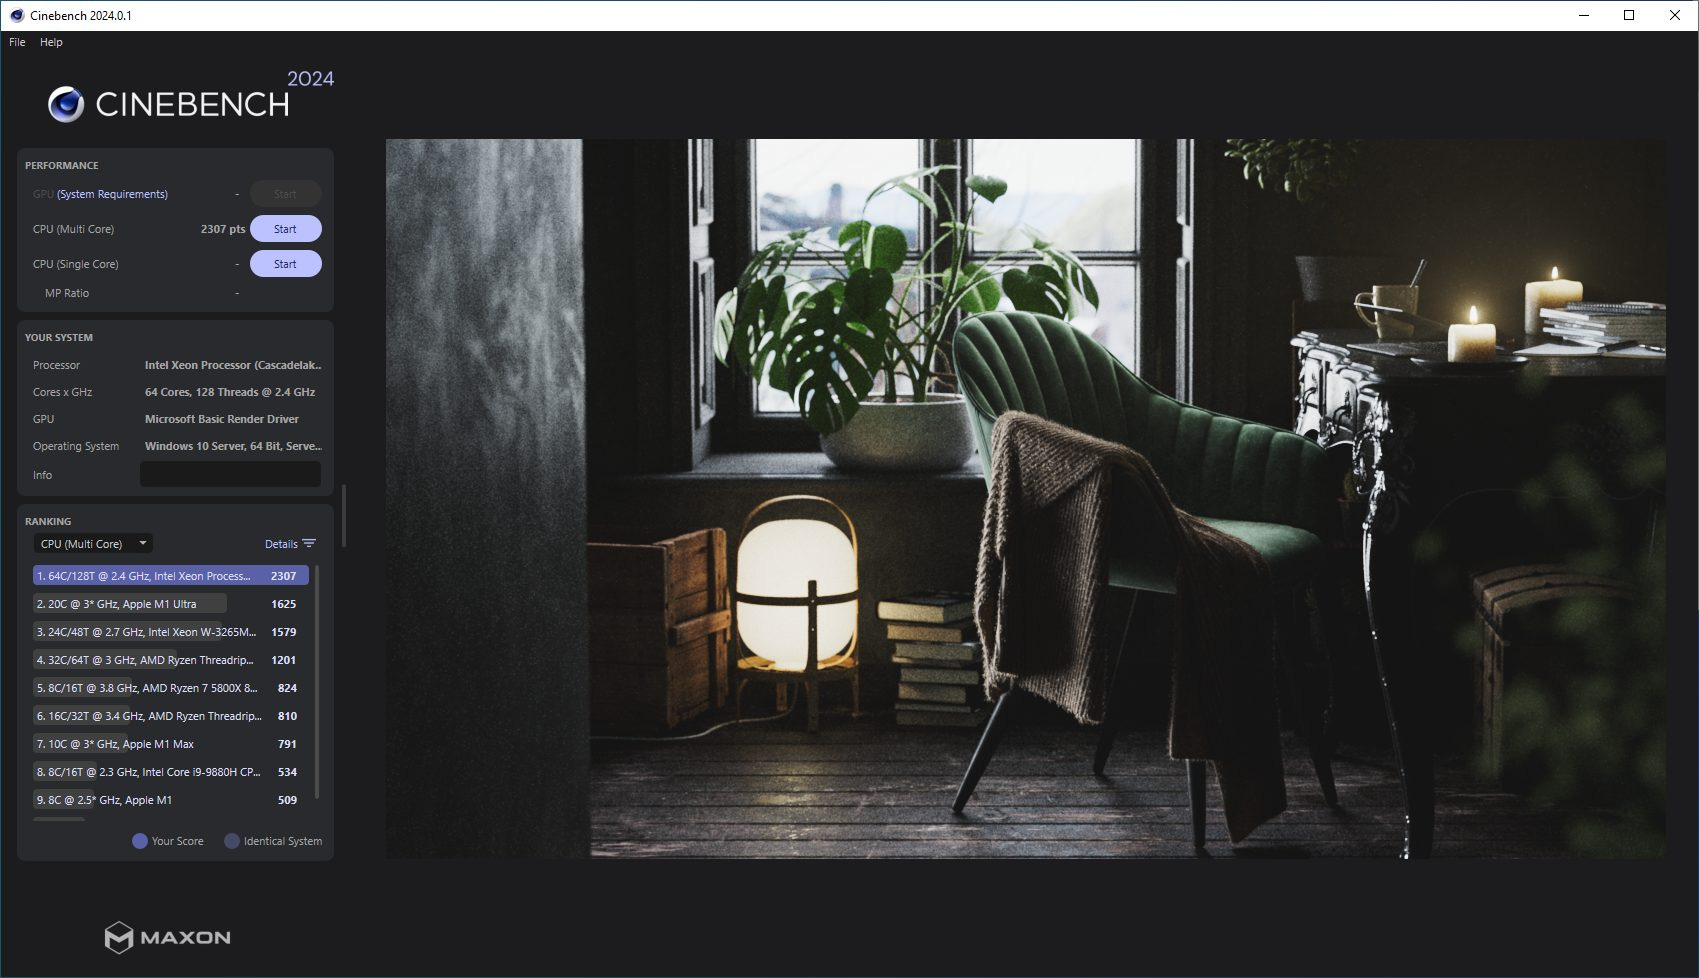
Maxon updates Cinebench every few years. Today, we have Cinebench 2024. I’m going to turn the tables and evaluate Cinebench 2024 as a benchmark by looking at the challenges it presents to the CPU pipeline.
Executed Instructions
From running Cinebench under Intel’s Software Development Emulator, Cinebench 2024 heavily leverages the AVX extension. Like libx264 video encoding, scalar integer instructions still play a major role. Both libx264 and Cinebench contrast with Y-Cruncher, which is dominated by AVX-512 instructions. AVX-512 is used in Cinebench 2024, but in such low amounts that it’s irrelevant.

Although SSE and AVX provide 128-bit and 256-bit vector support respectively, Cinebench 2024 makes little use of vector compute. Most AVX or SSE instructions operate on scalar values. The most common FP/vector math instructions are VMULSS (scalar FP32 multiply) and VADDSS (scalar FP32 add). About 6.8% of instructions do math on 128-bit vectors. 256-bit vectors are nearly absent, but AVX isn’t just about vector length. It provides non-destructive three operand instruction formats, and Cinebench leverages that.

AVX instructions are longer due to extra prefix bytes, which identify the instruction as belonging to the extension and provide extra fields to specify vector length and additional register inputs. Cinebench 2024’s instructions are 4.49 bytes long on average. Older Intel CPUs like Haswell and Skylake are capable of sustaining four micro-ops per cycle, which roughly corresponds to four instructions per cycle because most x86 instructions decode to a single micro-op. Doing so would require 18 bytes per cycle of instruction bandwidth on average. Prior to Golden Cove, Intel’s instruction cache could only deliver 16 bytes per cycle. That could limit performance unless instructions come from the micro-op cache, or the CPU hits other limits first (which they do).
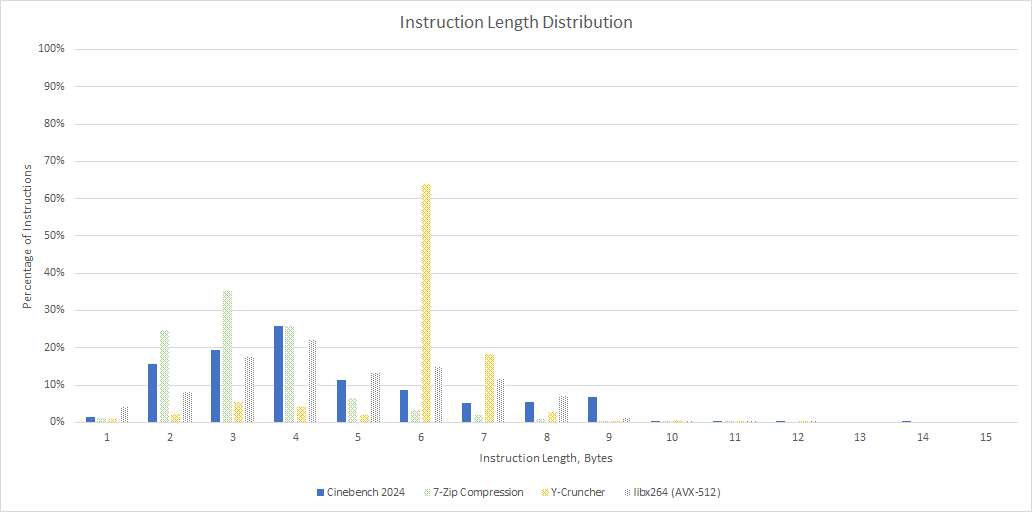
Breaking down the instruction lengths shows a tail of longer instructions, with few instructions reaching 8 bytes or longer. Instructions that are 4 bytes or below are likely scalar integer instructions, while longer ones would be AVX ones. Cinebench 2024 contrasts with Y-Cruncher, where heavy AVX-512 use skews the distribution towards longer instruction lengths. 7-Zip is the opposite. Its exclusive use of scalar integer code gives it shorter instruction lengths on average.

Besides math instructions, 22.6% of instructions read from memory, 7.85% write to memory, and around 9% are branches. Cinebench thus has an approximately 3 to 1 load-to-store ratio, placing it between 7-Zip and libx264.
Profiling the Benchmark
Next, we can run Cinebench 2024 and use performance counters to see how CPU architecture affects it. I’ll primarily be using AMD’s Ryzen 9 7950X, with some data thrown in from the Ryzen 9 3950X and Intel’s Core i7-7700K for good measure. On all CPUs, I’m using custom code to access performance counter features like count masks. On Intel, I’ve used VTune as well.
Overview
A CPU’s frontend brings instructions into the pipeline. Instructions have their registers renamed and other resources allocated in the backend, which then executes them as data becomes available. Throughput can go down if instructions aren’t brought in fast enough (frontend bound). If the backend can’t process instructions quickly enough, it can block the renamer as queues fill up.
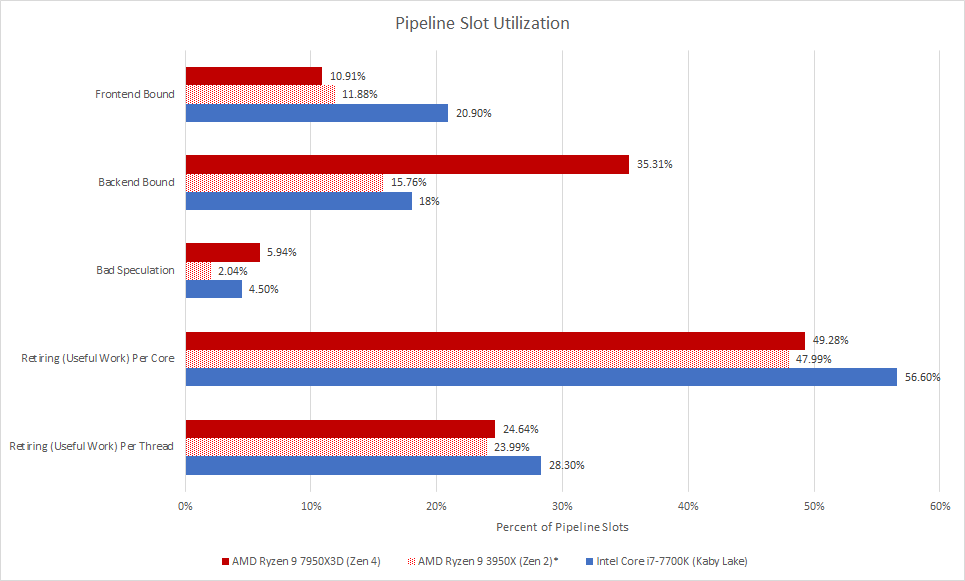
Unlike games where performance issues were focused in the frontend, Cinebench 2024 is primarily backend bound on Zen 4. Kaby Lake shows different behavior and is almost equally frontend and backend bound. But even though they’re losing cycles to backend and frontend stalls, all three CPUs enjoy decent core throughput.
The Ryzen 7950X3D, Ryzen 3950X, and Core i7-7700K averaged 1.44, 1.2, and 1.07 IPC per thread, respectively. We can double those figures to get per-core throughput because Cinebench 2024 hits all available threads. Thus, all three CPUs achieve well over 2 IPC per core. IPC is much higher than in games but isn’t high enough to push the limits of core width.
Frontend
The frontend’s main challenges involve contending with branches and cache misses. Both challenges are related because code execution proceeds in a straight line until you hit a branch. Quickly and accurately following branches is critical to hiding cache latency and keeping the core fed with instructions.
Branch Prediction
Cinebench 2024 has fewer and more predictable branches than the gaming workloads we looked at previously. All three CPUs enjoy high branch prediction accuracy and see less than two mispredicts per 1000 instructions (MPKI). As a result, they don’t lose much work to going down the wrong path.

In absolute terms, Zen 4’s branch predictor leads the pack. However, it suffers most from bad speculation likely because it has a very fast frontend and more backend reordering capacity. After a mispredict, Zen 4 can bring in the wrong instructions faster, and bring in more of them before the backend runs out of queue entries. That’s why CPU designers have to keep investing in the branch predictor. Otherwise, improvements elsewhere won’t reach their potential.

Besides accuracy, a branch predictor needs to be fast. Branch target buffers remember targets for recently seen branches, helping the predictor get to the branch destination even if the branch instructions hasn’t arrived at the frontend yet. Cinebench 2024’s “hot” branch footprint is somewhere under 1536 branches because Zen 4 barely sees any L2 BTB overrides. AMD’s latest architecture rarely has to pause for three cycles (L2 BTB Override) after a taken branch.

Zen 2 has a slower triple level BTB setup. The tiny 16 entry L0 BTB can do zero bubble branching but isn’t large enough. Most branches get their target out of the L1 BTB, but a significant number of branches still fall through to hit the slow L2 BTB. The L2 BTB creates five bubbles after a taken branch and thus reduces frontend throughput, especially if taken branches are in close proximity. Like Zen 4, decoder overrides are rare. At least the L2 BTB lets the branch predictor follow the instruction stream in the face of L1i misses, if slowly.

Intel has been good at fast branching for a long time. Haswell and Skylake can handle up to 128 branches with zero bubbles. Then, a 4096 entry main BTB helps capture the vast majority of branches. Skylake suffers more last level BTB misses than Zen 2 and Zen 4, and Intel’s frontend will have more trouble keeping up after an instruction cache miss. However, such misses happen rarely enough that it’s not a big deal.
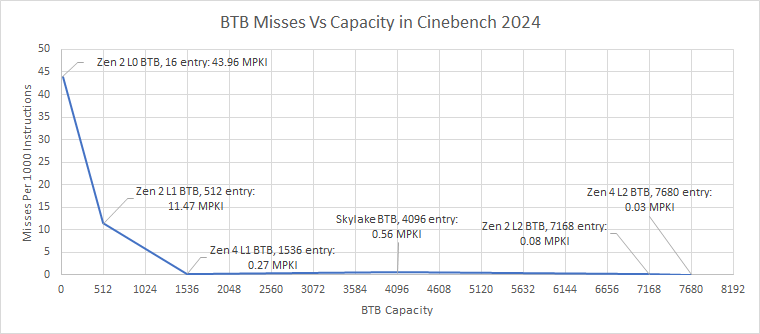
Plotting all of the BTB sizes across tested CPUs gives us a good picture of how many branch targets we have to cache for Cinebench 2024. 512 entries is not enough, but a 1536 entry BTB gets you most of the way there. Passing 7K BTB entries will almost eliminate decoder redirects, or BAClears in Intel terminology.
Instruction Fetch
Once the branch predictor has decided where to go, it’s time to translate instructions into internal micro-ops. On Zen 4, a loop buffer with 144 entries (split 2×72 if both SMT threads are active) is the fastest micro-op source. In Cinebench it barely captures any code, so we can infer that Cinebench doesn’t have a lot of tiny, frequently executed loops. Zen 2 has no loop buffer at all, while Kaby Lake has its 2×64 entry loop buffer disabled due to bugs.

Therefore, the micro-op cache is the first main source of micro-op delivery for all three cores. Zen 4’s 6912 entry micro-op cache provides good coverage. Decoders still deliver 20.52% of micro-ops, so they still matter a bit. Zen 2 sees a half and half split between its decoders and 4096 entry micro-op cache. Kaby Lake’s smaller 1536 entry micro-op cache covers less than 20% of the instruction stream, so its 4-wide decoder does the heavy lifting.
Like games, Cinebench 2024 challenges the frontend with a sizeable instruction footprint. The L2 cache ends up containing most of Cinebench 2024’s code on all of these CPUs. A larger L2 helps, but even Kaby Lake’s 256 KB L2 is large enough to ensure less than 0.1% of instructions cause a fetch from L3 or beyond.

Zen 4, Zen 2, and Kaby Lake are all capable of high instruction throughput when running code from L2. Branch mispredicts and BTB misses are rare enough to make sure L2 latency is hidden most of the time, so that’s exactly what happens. But even though instruction throughput remains high, power efficiency suffers. Compared to L1 caches, the L2 is optimized more for high density than low access power. Frequently fetching code from L2 (about once every 17-25 cycles) has an associated power cost.

On the Ryzen 7950X3D, L2 hit bandwidth can exceed 350 GB/s. Code fetches account for a substantial portion of that traffic. Combined with data-side accesses, the L2 gets a request roughly once every ten cycles.

Overall, Cinebench 2024 is kinder to the CPU’s frontend than gaming workloads are, but it’s not a cakewalk. A moderately sized branch footprint and branches that aren’t completely predictable tests the frontend’s ability to keep pace. Cinebench 2024 rewards CPUs with strong branch predictors and big micro-op caches. Mispredicts and BTB misses can be punishing because the code footprint spills into L2.
Backend
Once the frontend has provided instructions, the renamer allocates queue and buffer entries in the backend to enable out-of-order execution. Cinebench 2024 doesn’t stress any resource too heavily on AMD’s architectures and often fills the reorder buffer. The reorder buffer tracks all instructions in flight and can be seen as a cap on how far the core can search for instruction level parallelism ahead of a stalled instruction.

A full reorder buffer isn’t necessarily a bad thing, because it indicates other backend structures are sized well. However, there’s room for improvement. The store queue fills a lot compared to other structures. Between the two Zen generations, Zen 2’s scheduler is weaker than Zen 4’s. Individual queues don’t fill often, but Zen 2 sometimes takes miscellaneous scheduler related stalls and those add up.

Kaby Lake uses a 58 entry unified scheduler for both floating point and integer operations, while a separate unified scheduler handles address generation for memory accesses. Other structures differ too. Loads can’t leave Intel’s load buffer until retirement, while they can leave AMD’s load queue. Analyzing Kaby Lake is more difficult because performance events for most structures aren’t documented (except the store buffer). Events from prior Intel architectures still seem to work but take the info here with a grain of salt.

The unified scheduler stands out as the top stall reason on the Core i7-7700K. A unified scheduler can outperform a distributed one with a similar amount of entries, but AMD brings more entries to bear. Zen 2 has 64 entries in its distributed integer scheduler, while Zen 4 has 96. The disparity increases further when AMD’s separate floating point scheduler comes into play. About 37% of Cinebench’s instruction stream consists of FP/vector instructions. Including the FP scheduler gives Zen 2 100 total scheduler entries, while Zen 4 has 160.
Thus, Cinebench 2024 rewards CPUs with high scheduling capacity for integer and FP operations. Assuming enough scheduler capacity is available, Cinebench then benefits from larger load/store queues and ROB capacity.
Execution Resources
Execution units on a CPU are organized into different sub-pipelines, fed by ports from the scheduler and register file. Instructions that go to different ports/pipes can start execution in the same cycle. CPU designers try to organize execution units to spread load across different pipes, and try to avoid situations where IPC is limited because too many instructions have to go down a small subset of pipes.
For AMD, we have to focus on FP pipe utilization because there are no counters for integer pipes. Even those are a bit funny, so check the appendix for details.

Operations are well distributed across Zen 4’s 6-pipe FPU. The FP store pipes see very light load, while the FP add and multiply pipes do most of the work. Zen 4’s FPU is probably better seen as an enhanced quad-pipe unit with store operations offloaded.
Zen 2’s quad pipe FPU is less well balanced. FP2 handles both floating point adds and write operations, and sees higher utilization than other pipes. However, just above 30% utilization indicates the pipe is nowhere near being overloaded.

Kaby Lake has a dual pipe FPU. FP operations share ports 0 and 1 with integer operations. Those pipes are well utilized, but utilization levels are not high enough to cause concern.

Intel has utilization counters for all ports, and they show operations are well distributed across them. Based on utilization for ports 5 and 6, we can infer that AMD’s ALU execution capacity is more than adequate for Cinebench.
Caching
If you think CPU advances have been slow, DRAM is worse. Caching gets more important with every generation as computing power outpaces memory bandwidth. Cinebench 2024 is more cache friendly than games, so latency doesn’t hold the world back. Still, cache and memory access plays a significant role. Zen 4 appears to be more memory bound, but that’s because we’re tracking memory bound-ness in terms of pipeline slots. Zen 4 is 6-wide while Kaby Lake is 4-wide, so Zen 4 is having a harder time keeping all of its pipeline slots filled.

Cinebench 2024 has far easier data-side access patterns than games. L1 data cache misses only happen occasionally, while the L2 cache is able to capture the vast majority of data accesses. But Cinebench still isn’t a cakewalk. If an access is difficult enough to not be caught by L2, there’s a good chance it’ll miss L3 as well.

Thus Cinebench 2024 doesn’t act like prior Cinebench versions. Its data footprint is larger and results in more DRAM traffic. Data-side L3 miss rates lower than that of games, but Cinebench scales across all available CPU cores.

Higher core counts multiply memory bandwidth demands, so Cinebench ends up with around 20 GB/s of L3 miss bandwidth on AMD’s 16 core CPUs. Compare that to around 8.5 GB/s on COD Cold War or under 4 GB/s in ESO.
DRAM Access
Increased DRAM bandwidth demands can lead to higher average latency if requests start piling up behind the memory controller. Approaching bandwidth limits leads to a sharp latency increase, so latency and bandwidth are intertwined. Zen 4’s L3 miss latency is somewhat higher with Cinebench 2024 than with games, but the dual channel DDR5-5600 setup takes it well.

Zen 2’s story is a bit different. Cinebench uses 34.5% of the DDR4-3333 setup’s bandwidth on average. Higher load causes higher latency. Zen 2’s smaller buffers and queues will be stretched further to cover that latency, putting it at a disadvantage compared to Zen 4.

Kaby Lake’s DDR4-2400 configuration has the lowest bandwidth of the CPUs tested here, but the i7-7700K also has the lowest bandwidth demands thanks to its low core count. Even though each Kaby Lake core eats more DRAM bandwidth than a Zen 2 or Zen 4 core, the combined load on the memory controller is low enough that latency doesn’t rise much. However, a hypothetical 16 core Kaby Lake CPU on the same memory setup would likely run into bandwidth limitations.
Final Words
Maxon designed Cinebench to measure rendering performance, but we can look at how similar Cinebench is to other workloads too. It’s not representative of gaming performance, where the frontend is challenged by a ton of branches and a large instruction footprint. It’s also not completely bandwidth or compute bound, setting it apart from the likes of Y-Cruncher. Video encoding is a closer comparison, though video encoders tend to emphasize vector performance more than Cinebench does.
By itself, Cinebench 2024 is a moderate IPC benchmark with a sizeable instruction and data footprint. Code spills into L2, but the instruction stream is easier to follow than what we saw in games. Decoupled branch predictors can thus keep the frontend fed even in the face of L1i misses. On the data side, Cinebench 2024 spills out of L3 and requires a modest amount of DRAM bandwidth. High scheduler capacity across integer and FP operations help keep more memory operations in flight in the face of DRAM latency. In that sense, Cinebench 2024 can be seen as Cinebench R23 with more emphasis on DRAM performance. When hitting the execution units, Cinebench 2024 uses scalar and 128-bit packed floating point operations. Wider vector execution units are not useful. Scalar integer performance plays an important role in keeping the FP execution units fed.
In the end, Cinebench 2024 poses decent challenges to the frontend and backend. It has a more realistic instruction footprint than SPEC2017, which has no subtest with more than 12 L1i MPKI. Maxon has also addressed Cinebench R15 and R23’s small data-side footprint, which could be mostly contained by a 8 MB last level cache. High core count systems could be constrained by memory bandwidth, which happens across a lot of other well-threaded applications. These characteristics make Cinebench a decent benchmark. There’s area for improvement though. It could be a better stress test if it more heavily leverages vector execution. Hopefully the next version of Cinebench is better vectorized.
If you like our articles and journalism, and you want to support us in our endeavors, then consider heading over to our Patreon or our PayPal if you want to toss a few bucks our way. If you would like to talk with the Chips and Cheese staff and the people behind the scenes, then consider joining our Discord.
Appendix
Top-Down Accounting for Zen 2
Zen 2 does not have performance monitoring events that can account for lost pipeline slots at rename. I’m providing estimates for frontend and backend bound cycles with metrics that count at the cycle granularity. Frontend bound cycles are estimated with the micro-op queue empty metric. Backend bound cycles are estimated by adding up both dispatch stall metrics (Zen 2 splits them across two events). Frontend bound slots will be underestimated because I can’t account for cycles where the frontend didn’t provide enough micro-ops to fill all renamer slots.
For Zen 2, retiring (core utilization) was calculated with 5 instructions as the core width. Zen 2’s renamer can handle 6 micro-ops per cycle, but only from 5 instructions. Since most instructions decode to a single micro-op, I think the 5 instruction per cycle limitation is more relevant when determining core width. For other CPUs, micro-ops were used. That’s 4 micro-ops per cycles for the i7-7700K, and 6 micro-ops per cycle for the 7950X3D.
Data-Side Cache Hitrates
On AMD, I’m using events that count demand data cache refills. Demand means that the accesses are initiated by an instruction, as opposed to prefetchers. Intel’s events work differently and count at instruction retirement. Evidently, Intel is tagging instructions with where they got load data from, and have performance monitoring counters incremented at the retirement stage. AMD’s events will have higher counts because they consider speculative accesses as well as ones that are retired. For example if an instruction misses L1D but gets thrown out because of a branch mispredict, that miss is counted for AMD but not for Intel.
For L1D hitrates, Intel and AMD’s events will only count the first access to a 64 byte cacheline as a miss. If an instruction encounters a L1D miss but a refill request is already pending for that cacheline, it won’t be counted as an additional miss.
DRAM Latency
Intel and AMD provide performance monitoring events to measure DRAM access latency, but these have to be placed after the cache hierarchy. Otherwise, accesses serviced from cache hits would be included in the latency calculation. On Zen 4, I’m using events at the L3 cache that sample a random subset of L3 misses and measure their latency. On Zen 2, I’m using L3 events that measure the number of pending L3 misses and how many L3 misses are in flight. That lets me solve Little’s Law for latency.
Kaby Lake doesn’t provide counters for queue occupancy at L3, but Intel does have such monitoring at the system agent’s arbitration queue. Compared to Zen 4 and Zen 2, measuring latency at this point will provide lower figures because it excludes time spent traversing the on-chip interconnect. The goal here is to use latency to evaluate the impact of Cinebench 2024’s heavier DRAM bandwidth usage, not to provide comparable latency figures.
FP Pipe Utilization on AMD
AMD provides a counter event called FP pipe assignment to indicate how busy the FP pipelines are. This event counts at the rename stage when operations are assigned to a pipe and sent to a scheduler. Contrast that with Intel’s event, which counts when an operation is sent from the scheduler to an execution port.

Normally AMD’s event would be a good proxy for FP pipe utilization, but Zen 4’s AVX-512 implementation throws a wrench in the works. An instruction operating on a 512-bit vector is kept as a single micro-op, but sent twice from the scheduler to the execution pipe. That means one FPU pipe assignment will be counted even though a 512-bit operation consumes two pipe issue cycles. Fortunately, Cinebench 2024 rarely uses 512-bit vectors so the event remains a good approximation.
The FP pipe assignment event has been removed from AMD’s processor programming reference manuals with Zen 2 and later architectures. However, experimenting with operations that go down certain pipes shows that it still works in Zen 2 and Zen 4.
This test does not work with either the RX 9700 XT or the nVidia 5000 series in laptops. This test is pointless if I can't run a 5 year old card or a newer one like the laptop 5090. I'm very disappointed. If anyone knows why the newest cards can't be tested, please tell me!