
Hot Chips 2023: Characterizing Gaming Workloads on Zen 4

AMD didn’t present a lot of new info about the Zen 4 core at their Hot Chips 2023 presentation. Uops.info has measured execution throughput and latency for instructions on Zen 4. We’ve dug deep into Zen 4’s microarchitecture in a set of articles as well. However, the Zen 4 core architecture is still an important component both of AMD’s Hot Chips presentations. I’m therefore going to throw a bit of a curveball, and look at Zen 4’s performance in gaming workloads, and use performance counters to get visibility into how Zen 4 internally handles gaming. That should help provide context to both of AMD’s presentations that involve Zen 4.
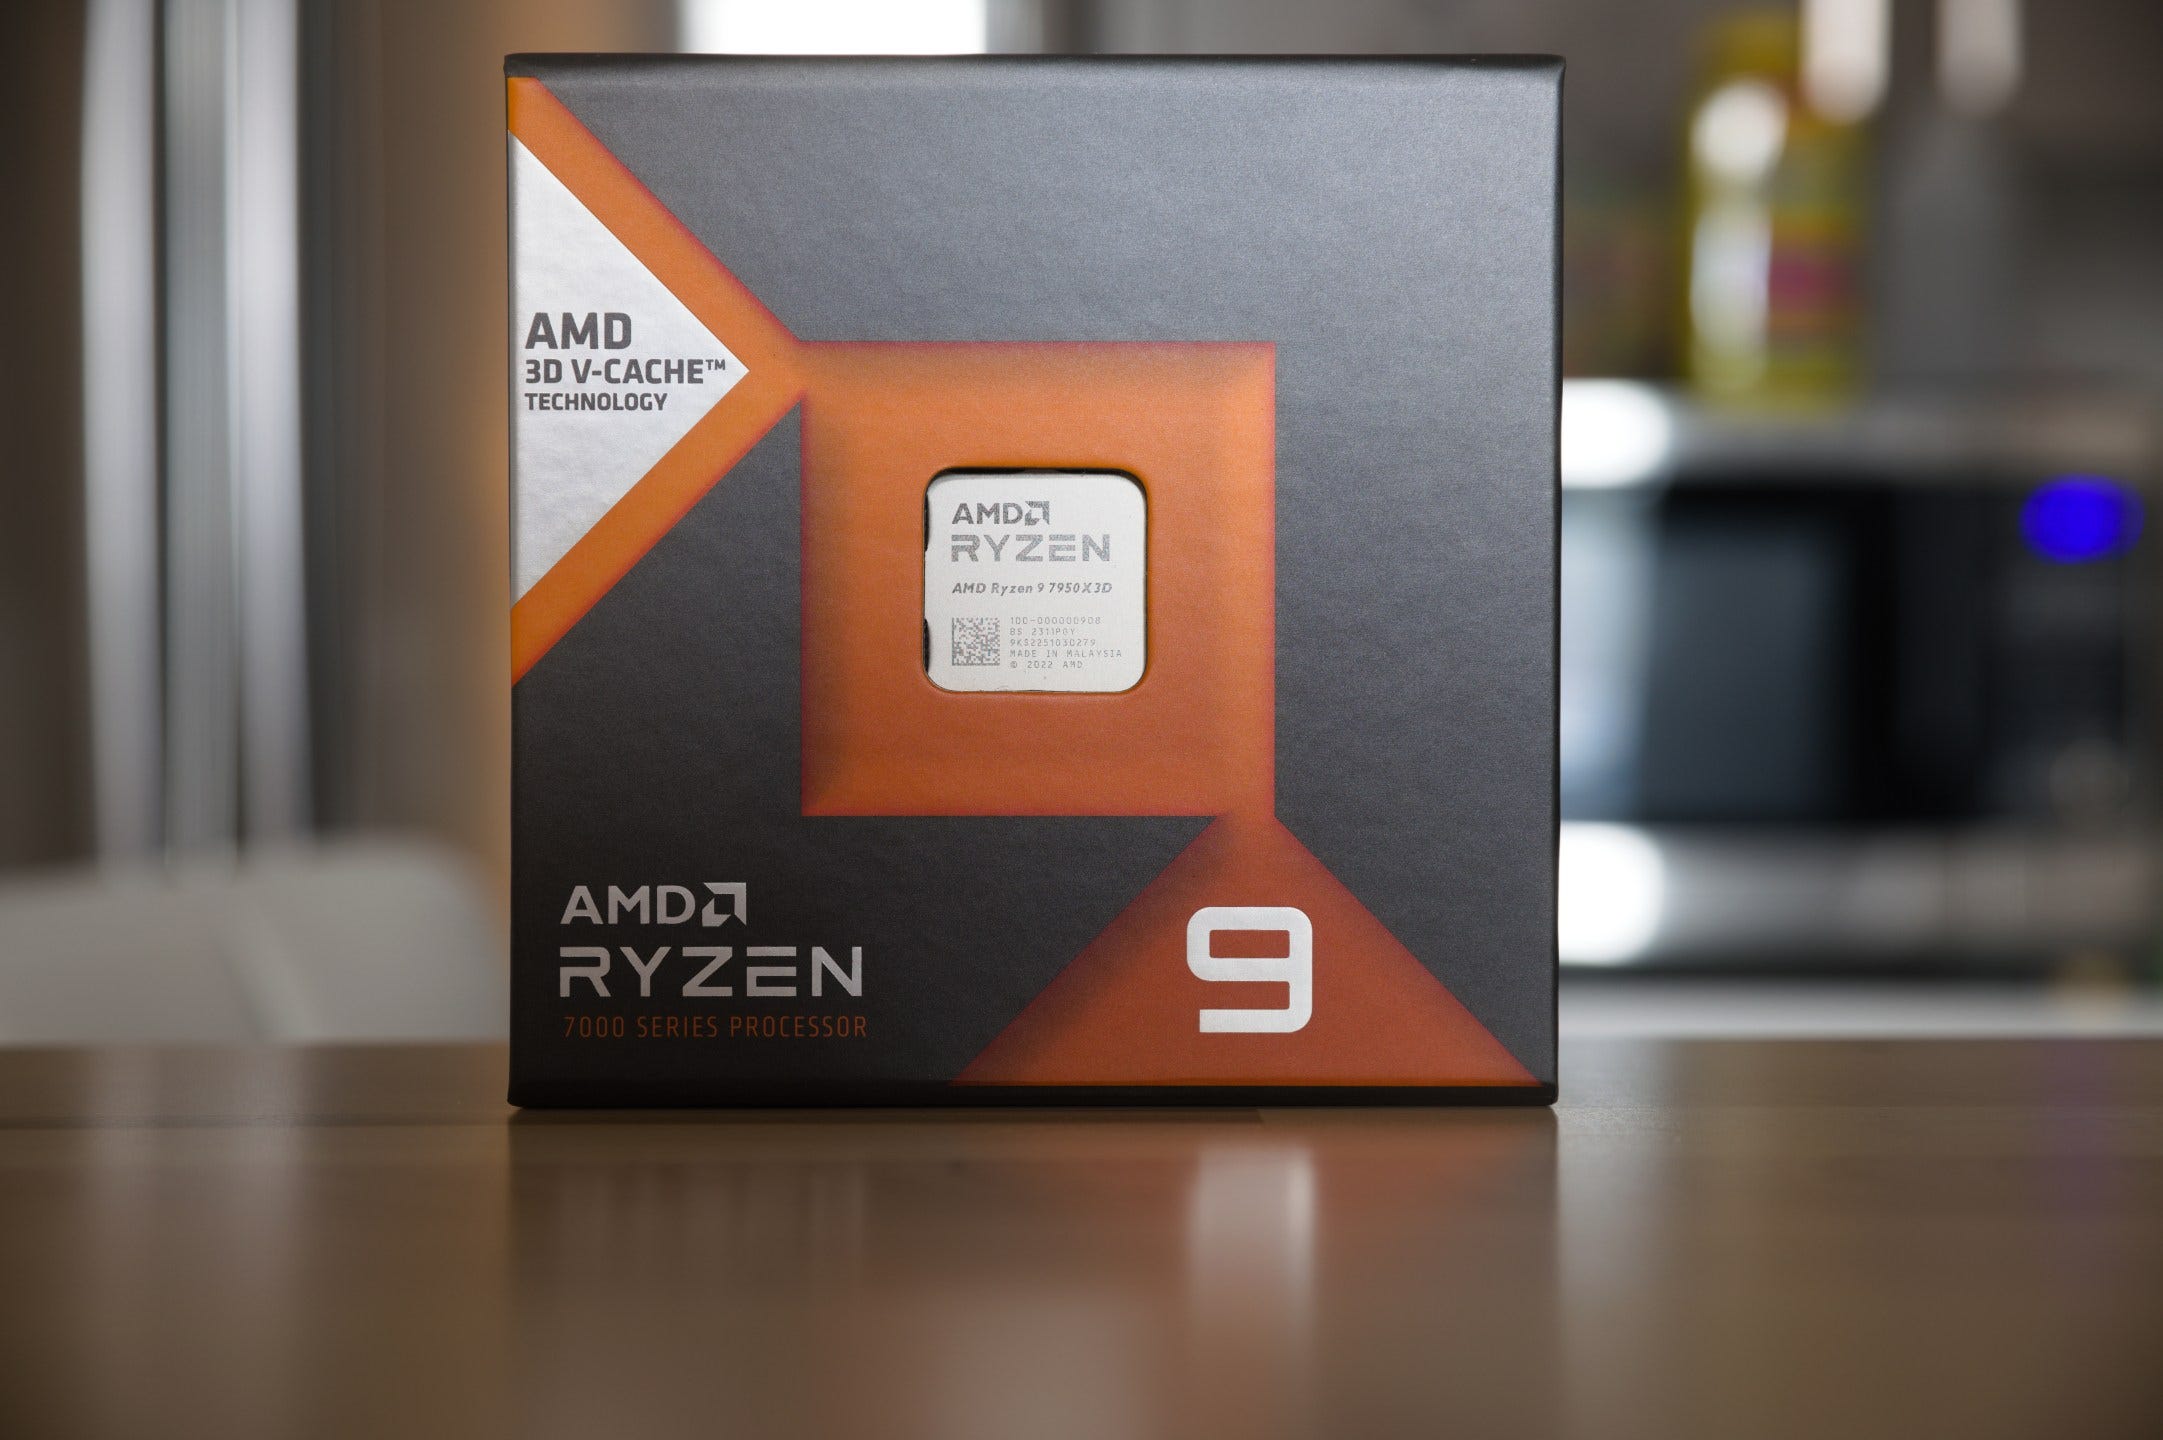
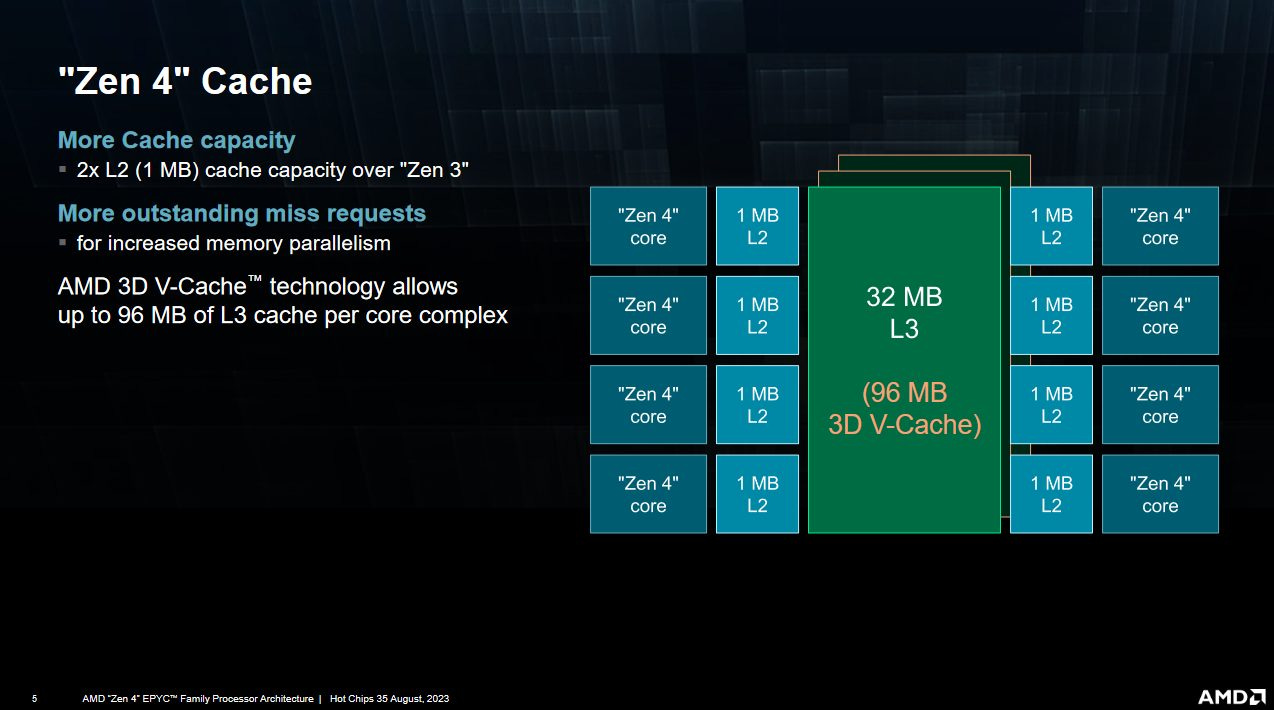
Here, I’m testing a couple of games on my Ryzen 9 7950X3D, namely The Elder Scrolls Online (ESO) and Call of Duty: Black Ops Cold War (CoD Cold War). On ESO, I’m grinding out experience in the Blackrose Prison arena. In CoD Cold War, I’m playing the Outbreak Collapse mode in the game’s zombies mode. I’m using my 7950X3D, which features 16 Zen 4 cores arranged in two complexes. One of these has 96 MB of L3 cache, thanks to AMD’s 3D V-Cache feature. For some level of consistency, both games have affinity set to the VCache enabled CCD. Core performance boost was disabled, giving a maximum clock of 4.2 GHz across all cores.
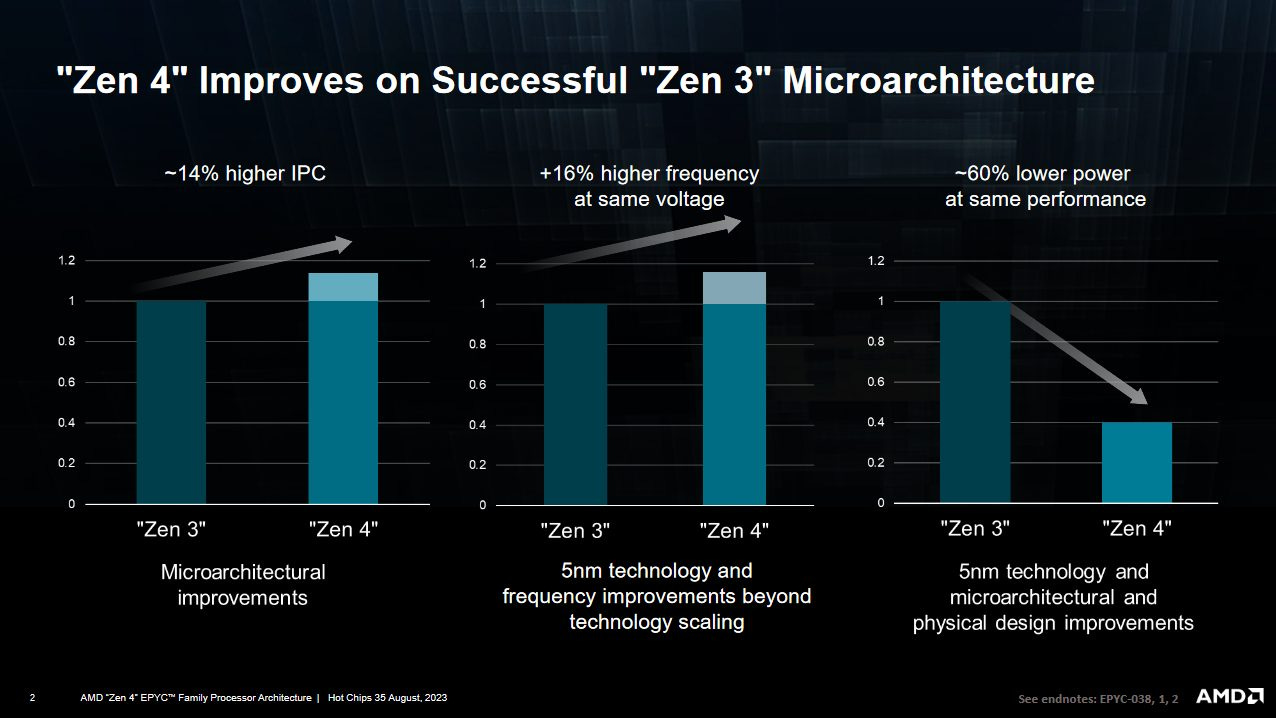
Zen 4 is AMD’s latest core architecture, and represents an iterative improvement over Zen 3. Alongside that, it brings all the goodies you’d expect from a node shrink. In a really cool move, Zen 4 brings a new set of performance monitoring events that lets us characterize utilization at the pipeline slot level. Intel has been able to do this to some extent since Sandy Bridge, but performance monitoring hardware in AMD’s CPUs could generally only do cycle level accounting. Zen 4 changes this.
My goal is to get a general picture of how gaming workloads behave on AMD’s Zen 4. Because these are multiplayer games, I expect a lot of variation and results that won’t be perfectly repeatable. Also, data was collected over multiple passes because Zen 4 only has six programmable performance counters, and I had to check more than six events to get a decent picture. Therefore, my goal is to get a high level picture of challenges faced by Zen 4 in these workloads, rather than drilling down figures to the last percentage point.
I recommend going over our prior articles on Zen 4’s core and memory subsystem.
High Level
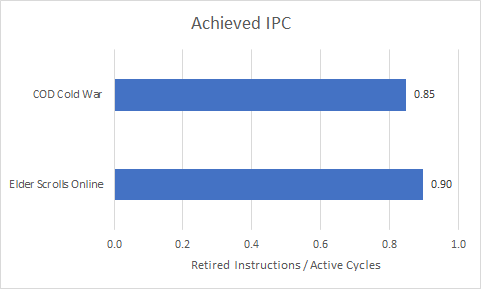
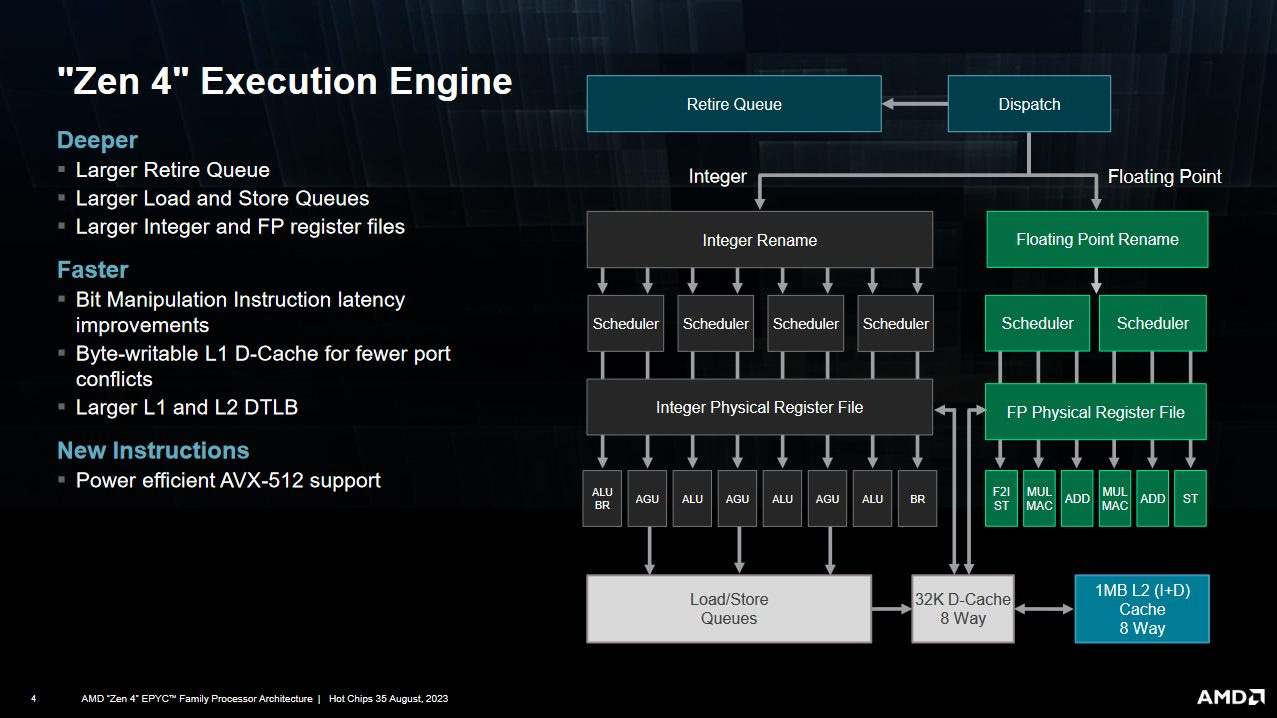
Both games experience low average IPC. Zen 4 is capable of sustaining 6 micro-ops per cycle. Most instructions decode into a single micro-op, so Zen 4 is roughly 6 instructions wide as well.
Zen 4’s sustained throughput is limited by the 6-wide rename stage, any throughput lost there can’t be recovered by racing to catch up later on. Like Intel’s CPUs, Zen 4 can account for lost rename throughput at the per-slot granularity.
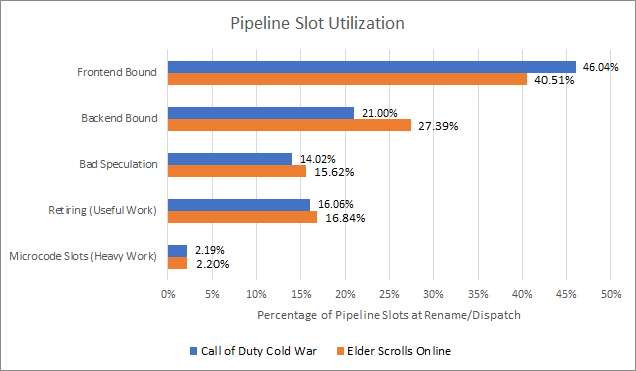
Both gaming workloads are overwhelmingly frontend bound. They’re significantly backend bound as well, and lose further throughput from bad speculation. Useful work occupies a relatively minor proportion of available pipeline slots, explaining the low IPC.
Frontend
Because a plurality of available pipeline slots are frontend bound, let’s start there. By AMD’s definition, a slot is frontend bound if the renamer had available slots that weren’t utilized because no micro-ops were available from the frontend. AMD’s Processor Programming Reference (PPR) further splits frontend bound slots into latency and bandwidth bound categories. Specifically, slots are considered latency bound if the frontend doesn’t supply any micro-ops during that cycle. If the frontend supplied some micro-ops but not enough to fill all six slots, the unfilled slots are considered bandwidth bound.
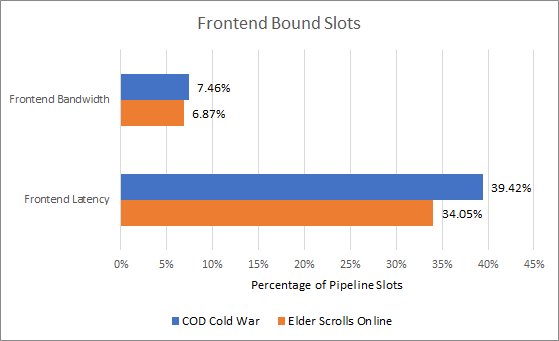
Zen 4’s frontend is overwhelmingly latency bound. Frontend latency can come from cache misses, as well as branch predictor related delays. We can start to unravel the frontend latency problem by looking at where instructions are coming from. Zen 4 can feed its pipeline from three different sources. A 144-entry loop buffer provides very fast micro-op delivery for tiny loops. Then, a 6.75k entry micro-op cache tries to contain hot sections of code. Finally, a 32 KB L1 instruction cache focuses on providing high caching density by directly caching x86 instructions, and takes advantage of x86’s shorter, variable length instructions.
Neither game has a lot of small, hot loops, so the loop buffer is almost a non-factor. The micro-op cache enjoys 70-81% hitrate in both games, indicating that they spend a lot of time executing code with good locality. The instruction cache does a decent job with 71-77% hitrate, but misses per instruction shows a different picture. 17-20 MPKI L1i is quite a high miss rate. The L2 cache helps backstop these L1i misses, but occasionally some instruction fetches fall through L2 as well. Unfortunately, Zen 4’s performance monitoring events can’t distinguish between code fetches from L3 or DRAM.

Instruction cache misses aren’t necessarily a big problem. We’ve seen in microbenchmarks that Zen 4 is capable of sustaining close to 4 IPC even when running code from L2 or L3. However, that assumes the branch predictor generates targets far enough ahead to hide latency. The L2 prefetcher likely helps too, particularly for very predictable patterns like linear code fetches. But ESO and COD Cold War have a ton of branches. On average, there’s a branch every four to five instructions.

Therefore, the branch predictor is heavily involved in keeping the frontend running smoothly. To follow branches quickly and keep effective branch latency down, Zen 4 has a multi-level BTBs (branch target buffers) that remember where recently executed branches went.
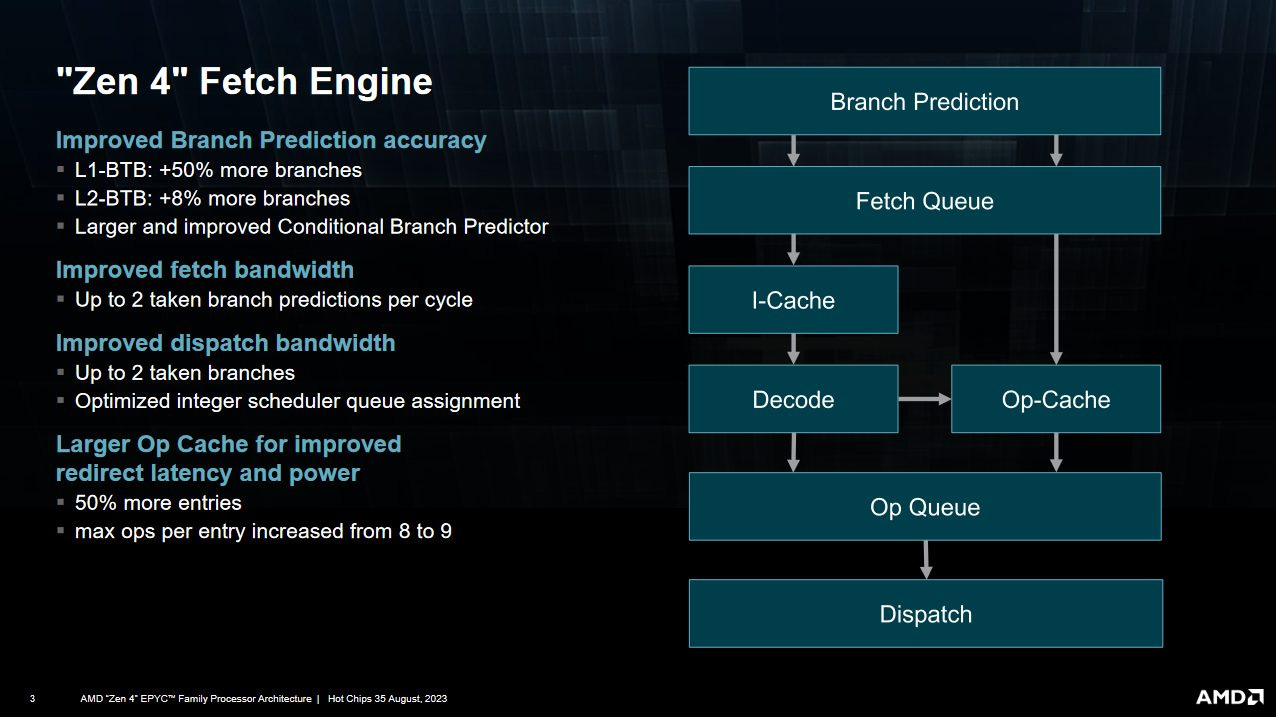
The 1536 entry L1 BTB can deliver taken branch targets back to back, so lost throughput there would be counted as frontend bandwidth bound (just from losing instructions fetched past a taken branch). The larger 7680 entry L2 BTB causes three “bubble” cycles in the branch predictor, meaning three cycles of fetch address generation get lost. Predicting indirect branches incurs a similar penalty. In a workload with fewer branches, these bubbles might be tolerable because the frontend can provide pretty high bandwidth in a straight line.

For example, the micro-op cache can deliver 9 micro-ops per cycle, letting it run ahead of the renamer and fill up an op queue in front of it. Any op cache fetch hiccups would run down some op queue entries before the frontend catches back up. Similarly, the L1 instruction cache can provide 32 bytes per cycle, which corresponds to eight or more x86 instructions in integer code. However, taken branches will spoil that frontend bandwidth because branch targets may be well after the start of a fetch-width aligned block, and any micro-ops or instruction bytes fetched after a taken branch aren’t useful. Therefore, BTB performance matters when the frontend is struggling to keep up.
Zen 4’s L1 BTB catches the vast majority of branches, but we still see a few slip over into the L2 BTB. Indirect branch predictions also see a 3 cycle penalty, and including that means we see a 3 cycle taken branch penalty in about 1 in 100 instructions. BTB latency isn’t a massive deal here, and AMD has done a good job making the first level BTB large enough.

If the branch target isn’t cached at all, we have a bigger problem. Zen 4 handles that case by calculating the target when the branch instruction arrives at the decoders. While such “decoder overrides” don’t happen very often, they can be very expensive because they prevent the branch predictor from running ahead of the frontend. After all, the decoder can’t calculate the branch target until the branch bytes show up at the core. If a decoder override points to a branch target in L2, you’re looking at around a dozen cycles of lost frontend throughput. If the branch target is in L3, expect the frontend to spend the next 40+ cycles without instructions coming in, thanks to cache latency. Therefore, decoder overrides potentially result in more lost frontend throughput than L2 BTB or indirect predictor latency, particularly if most branches that suffer decoder overrides are fetched from L3.
Instruction TLBs
Cache latency can be exacerbated by address translation penalties. Zen 4 caches instruction-side address translations with two levels of translation lookaside buffers (TLBs).

The 64 entry iTLB sees high hitrate if we count every L1i access as a iTLB access, but looking at misses per instruction tells another story. COD Cold War sees a good number of iTLB misses, suggesting its instruction footprint goes beyond 256 KB. ESO does a bit better, but both MPKI and hitrate metrics can be deceptive. The frontend will only initiate one L2 iTLB or page walk in response for multiple iTLB misses to the same page, so a single iTLB miss could be holding back several instruction fetches.
Fortunately Zen 4’s 512 entry L2 iTLB is enough to handle most instruction fetches. Misses are reasonably rare on both games, indicating that instruction footprint doesn’t often go beyond 2 MB.
Bad Speculation
We previously covered how quickly the branch predictor can feed the frontend. Speed is important, but accuracy is too. Mispredicting a branch is like a terrible version of a decoder override. You incur frontend cache latency, and have to discard any instructions pulled into the backend after the mispredicted branch. We often see people talk about pipeline length from fetch to execute, but that’s really just a minimum figure. Branch mispredicts can incur much higher costs if the mispredicted branch sat in the scheduler for dozens of cycles due to dependencies. The core could have fetched piles of instructions from the wrong path in the meantime, and all of that work will be wasted.
On the other hand, checkpointing allows the CPU to recover quickly from a mispredicted branch and overlap the mispredict penalty with execution of micro-ops from before the mispredicted branch. To better characterize the cost of mispredicted branches, we can focus on how much renamer throughput was spent pulling in micro-ops that were never retired. A micro-op that’s not retired never gets its results made final and program visible. Technically the CPU can throw work out for other reasons, but branch mispredicts are the main cause.

AMD has invested heavily in making a very capable branch predictor. It does achieve very high accuracy, but we still see 4-5 mispredicts per 1000 instructions. That results in 13-15% of core throughput getting lost due to going down the wrong path.
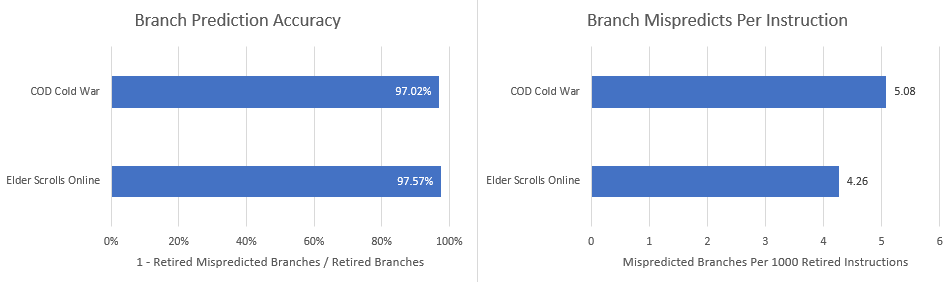
Again, we have a problem because these games simply have a ton of branches. Even with over 97% accuracy, you’re going to run into mispredicts fairly often if there’s a branch every four to five instructions. With regards to frontend throughput, a mispredict is basically a worse version of a decoder override. Branch mispredict penalty will vary depending on where the correct target comes from, and getting a target from L2 or L3 could easily add dozens of cycles on top of the minimum branch mispredict penalty. I expect AMD and everyone else to keep investing heavily in the branch predictor as they try for higher performance.
Backend Bound
When the renamer isn’t under-fed by the frontend or being fed the wrong stuff, it often can’t send a micro-op downstream because it couldn’t allocate a required resource in the backend. The rename stage is still in-order, so if any instruction needs an entry in a structure that’s full, no other micro-ops after it can proceed.
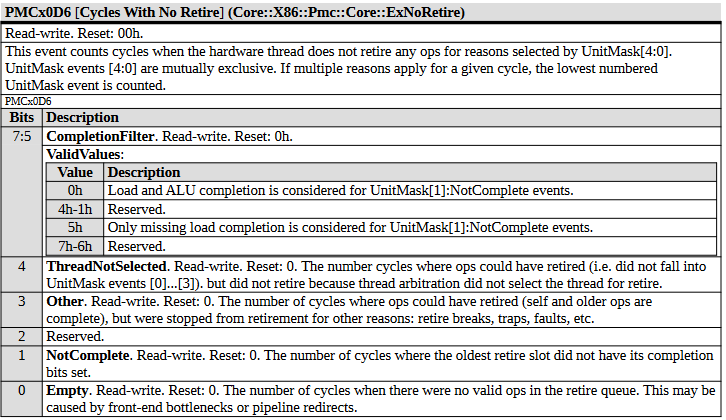
Zen 4’s PPR suggests breaking down backend bound stalls by going all the way forward to the retire stage, where instruction results are committed in-order. There, a new performance monitoring event lets us break down why retirement was stalled.

Memory loads are the biggest culprit. Adding more execution units or improving instruction execution latency wouldn’t do much, because the problem is feeding those execution units in the first place. Out of order execution can hide memory latency to some extent by moving ahead of a stalled instruction. How far ahead it can go depends on what resources the backend has to track in-flight operations. Zen 4’s schedulers, register files, and various queues are only so big. Eventually, something will fill and prevent the backend from receiving more instructions.
Zen 4 provides performance monitoring events to break down what structure filled up and limited reordering capacity, so let’s take a look.

Both games fill the reorder buffer quite often compared to other backend resources, so AMD’s designers hit a pretty good balance when sizing backend register files and queues. Zen 4’s integer and FP register files rarely fill. The store queue does stand out in COD Cold War. It’s also the top reason for a backend bound renamer stall in ESO if we exclude the ROB. However, making a larger store queue could be difficult because every load potentially has to check the address of every prior store for forwarding opportunities.

Zen 4 uses a distributed scheduling scheme that’s less straightforward to optimize than the unified schedulers we see with Intel, because we could get a dispatch stall if any individual queue fills. All of the scheduling queues put together are only responsible for 7.08% and 4.82% of stalled renamer cycles in ESO and COD Cold War, respectively. One particular integer scheduling queue stands out, since it can handle branches, memory accesses, and regular ALU instructions.
AMD could address this by adding more entries to that scheduling queue. But as we all know, coping with latency is just one way to go about things. Better caching means you don’t have to cope as hard, so let’s look at the data-side memory hierarchy.
Cache and Memory Access
The first step in performing a memory access is to translate the virtual address used by programs into physical addresses. Zen 4 uses a two level TLB setup to speed this up. The 72 entry first level DTLB suffers quite a few misses, and has an especially hard time in ESO. DTLB misses are often caught by the 3072 entry L2 DTLB, but that adds an extra 7-8 cycles of latency.

Just as with the frontend, DTLB misses can be deceptively low because the core will only queue up one TLB fill request if several nearby instructions suffer a TLB miss. With that in mind, 6-8 DTLB MPKI is actually quite high. The same applies for L2 DTLB misses. L2 DTLB misses are more expensive as well because page walks can involve several dependent memory accesses.
After address translation, memory accesses can be serviced by a triple level cache setup. The 32 KB L1D is rather small and sees a lot of misses. Most of these are caught by L2, which does a credible job as a mid-level cache. Then, the 7950X3D’s large 96 MB L3 helps catch nearly all L2 misses. VCache is therefore doing a good job of reducing backend stalls.
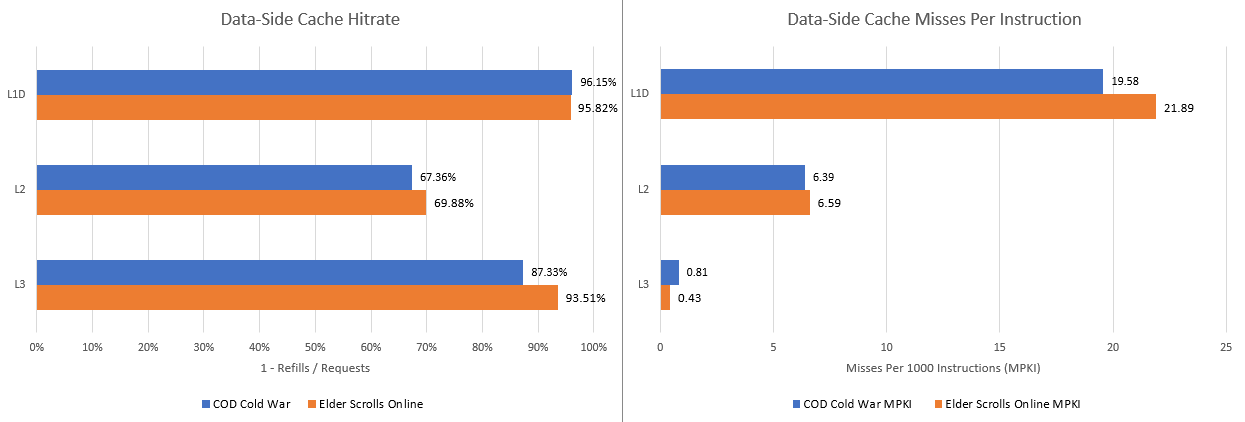
Again, performance counters are tracking cache refills. Multiple instructions accessing the same 64B cacheline will only initiate one refill request, so expect more instructions to be affected by cache misses than the count here would directly suggest.
L3 Cache, Cache Controller Perspective
When we looked at the frontend, core counters couldn’t distinguish between L1i fills from L3 or DRAM. However, I suspect a good chunk of code fetches went out to DRAM. L3 hitrate is much lower when we check performance counters at the L3 cache, which see all requests from the cores.

If the frontend does have to run code from L3, throughput will be well below 4 bytes per cycle. That would explain some of the frontend latency bound cycles.
Latency or Bandwidth Bound?
Zen 4’s backend is primarily memory bound in both games. That brings up the question of whether it’s latency or bandwidth bound. After all, bandwidth and latency are connected, because you’ll see a sharp latency increase as you reach bandwidth limits and requests start backing up in queues.
We can take advantage of that by monitoring how many L1D misses the cores have queued up. Zen 4 tracks L1D misses in what AMD calls miss address buffers (MABs). They’re roughly equivalent to Intel’s fill buffers, and are generically called miss status handling registers (MSHRs). Zen 4 provides a performance monitoring event that can track how many MABs are allocated each cycle. Because achieving high bandwidth means keeping enough requests in flight to hide latency, we can infer that the cores are asking for a lot of bandwidth if MAB occupancy is high. In contrast, if only a few MABs are allocated, then we’re likely latency bound.

MAB occupancy is typically low. Zen 4 is often waiting for data from L2, L3, or memory, but rarely had more than four such outstanding requests. For context, Intel’s Core 2 had eight fill buffers, and Golden Cove has 16. Zen 4 rarely needs that level of memory level parallelism, indicating that bandwidth isn’t an issue.
We can also focus on memory bandwidth by looking at average request latency. Zen 4 introduces a new performance monitoring event that randomly samples latency for requests sent to Infinity Fabric. This is a neat improvement over prior Zen generations, where you could calculate L3 miss latency in cycles by observing miss count and pending misses per cycle, but getting latency in nanoseconds was difficult unless you locked clock frequencies.
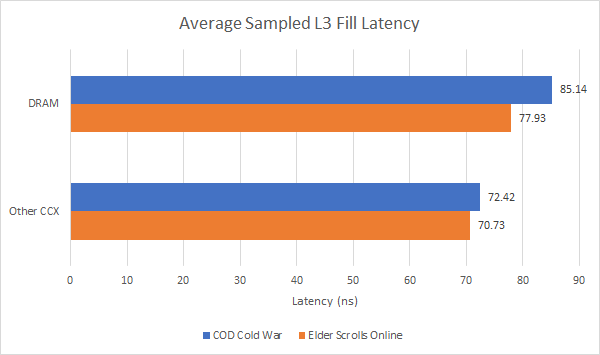
Average DRAM latency is well below 100 ns, so requests aren’t piling up at the memory controller. Keep in mind this figure measures DRAM latency from the L3 perspective, not the core’s perspective. Memory latency seen by software is going to be slightly higher, because the core has to check L1D, L2, and L3 before going to DRAM.
Final Words
COD Cold War and the Elder Scrolls Online both have very large instruction footprints with tons of branches, causing major problems for the in-order frontend. Both games also feature large data-side footprints, but the out-of-order backend is better positioned to cope with data-side memory access latency.
Zen 4’s improvements over Zen 3 are concentrated in the right areas. The larger ROB and supporting structures help absorb memory latency. Tracking more branches at faster BTB levels helps the frontend deal with giant instruction footprints, as does the larger L2 cache. But AMD still has room to improve. A 12K entry BTB like the one in Golden Cove could improve frontend instruction delivery. Branch predictor accuracy can always get better. The store queue’s size has not kept pace and sometimes limits effective reordering capacity. That said, the store queue is an expensive structure. AMD didn’t want to make store queue entries 512-bits wide for AVX-512, and adding more store queue entries would also mean area growth.
Making the STQ entries 512b would have meant doubling the STQ data storage. That area growth would have not been in line with our approach to AVX-512 on Zen4.
Kai Troester, AMD
From the data side, larger out-of-order queues and caching would obviously help. AMD has spent a lot of effort here. Zen 4’s 1 MB L2 cache and stacked 96 MB L3 cache both help improve average latency for instructions that access memory.
AMD should be commended for not wasting area and power chasing bragging rights. Zen 3’s scheduler layout was already quite good, and keeping it in Zen 4 makes sense. Matching Golden Cove’s 6-wide decoder would have been great for bragging rights, but won’t affect performance much. Widening the overall pipeline would also be a waste, because feeding that core width is more important than having more width.
Finally, this piece only looks at two multiplayer games. Zen 4 isn’t just a gaming CPU, and has to perform well in a variety of applications. If time permits, I plan to look at some of those in-depth and see how they differ from games. With that out of the way, Zen 4 looks like a very solid follow-on to Zen 3. AMD has made improvements in the most important areas, while resisting the temptation to bloat core area chasing diminishing returns. The core should do an excellent job in filling out AMD’s CPU portfolio, and I look forward to seeing how AMD follows up on Zen 4 in their future designs.
If you like our articles and journalism, and you want to support us in our endeavors, then consider heading over to our Patreon or our PayPal if you want to toss a few bucks our way. If you would like to talk with the Chips and Cheese staff and the people behind the scenes, then consider joining our Discord.