
Analyzing Zen 2’s Cinebench R15 Lead

Cinebench R15 (CBR15) is a popular benchmark based on Cinema4D’s 3D rendering engine. It can utilize all available CPU threads, but here we’ll be analyzing it in single thread mode. In short, Zen 2 pulls ahead thanks to its superior branch predictor, larger mid-level cache, and ability to track more pending floating point micro-ops in the backend.
Benchmark Overview
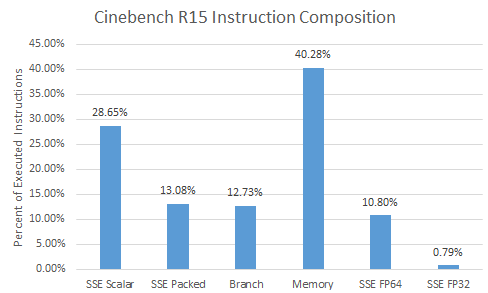
CBR15 uses a lot of SSE instructions (41.7%), and doesn’t take advantage of AVX. Most executed SSE instructions are scalar, so the benchmark does not heavily stress the CPU’s vector units. Floating point calculations are dominated by FP64, with a bit of FP32 sprinkled in. Curiously, there are almost twice as many FP64 multiplies (6.51%) as FP64 adds (3.73%). Over 40% of instructions access memory, with a roughly three times as many loads as stores.
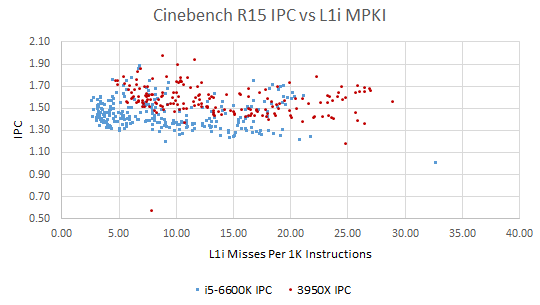
Every tile in CBR15 has different characteristics. Because we’re sampling performance counters at 1 second intervals, we can plot IPC versus various metrics. That lets us see if portions of CBR15 that have higher cache hitrates or lower mispredicts also have better IPC. Then, we can guess at how much a certain metric impacts performance.
Branch Prediction: A Significant AMD Lead
Branch predictors guess where to fetch instructions from without waiting for branch instructions to execute. An incorrect guess means fetching down the wrong path, hurting performance. When the execution engine figures out the actual target doesn’t match the predicted one, it has to squash wrongly fetched instructions and wait for instructions to be delivered from the correct path. To keep the execution pipeline correctly fed, both Skylake and Zen 2 implement incredibly complex branch predictors that take significant die area.
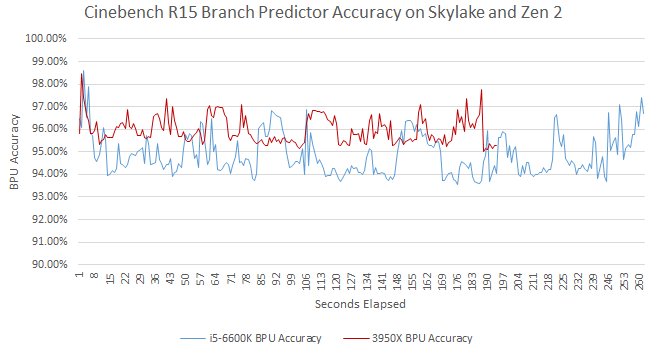
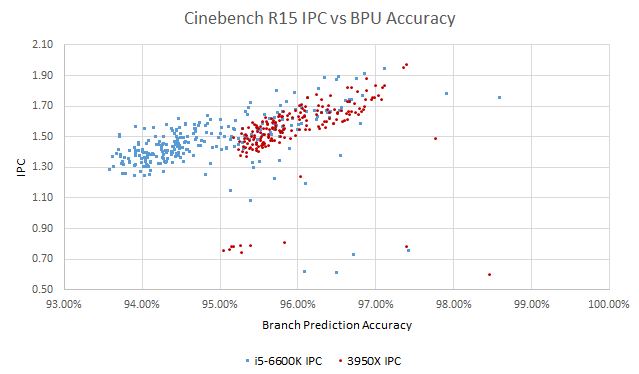
Zen 2’s massive branch predictor achieves 96% average accuracy, beating Skylake’s 94.9% average. Per-instruction, Skylake suffers 25% more mispredicted branches. To be exact, Zen 2 gets 5.15 branch mispredicts every thousand instructions (MPKI), while Skylake gets 6.45 branch MPKI.
A mispredict means the CPU is fetching down both the correct and incorrect path. Thus, more branch mispredicts will result in a higher op from frontend to instruction ratio. Here, Zen 2’s frontend delivered 1.39 ops per instruction retired, while the figure for Skylake is 1.63. Skylake wastes 17% more frontend bandwidth than Zen 2. Both CPUs have about a 1:1 micro-op to instruction retired ratio in this test, so the difference isn’t explained by either processor decoding instructions to more micro-ops.
We can also estimate how many cycles were wasted due to mispredicts. Zen 2’s optimization manual states that the mispredict penalty “is in the range from 12 to 18 cycles” while the “common case penalty is 16 cycles”. Agner Fog measured Skylake’s branch mispredict penalty to 15-20 cycles. Per 1000 instructions, Skylake loses 96.75 cycles minimum to mispredicts while Zen 2 loses 82.4. That’s a 17.4% fewer wasted cycles, in Zen 2’s favor.
AMD’s Non-Scheduling FP Queue: A Clever Approach
Traditionally, a micro-op sent to the backend is given a slot in the reorder buffer, scheduler, and some other queues depending on what exactly it does. Scheduler entries tend to be limited. Every cycle, the CPU potentially checks every scheduler entry to find something to send to the execution units. Skylake uses a unified scheduling queue for both integer and floating point operations. In total, Skylake has 97 scheduler entries. Zen 2 uses a distributed scheduler with a 16 entry scheduling queue for each ALU port, a 28 entry queue for the three address generation ports, and a 36 entry queue for the floating point unit. Zen 2 thus has a total of 128 scheduling entries.
From Henry Wong’s thesis, we know that a unified scheduler tends to do better for the same number of total entries. For example, 20 unified and 32 total distributed scheduler entries give similar IPC. This might hand Skylake an advantage. But Zen 2 has a trick up its sleeve with a 64 entry non-scheduling queue. A large non-scheduling queue should be cheaper to implement than a scheduling one. This config lets Zen 2’s FPU accept 100 micro-ops before it needs to block newer micro-ops from coming in. Zen 2 might not be able to check 100 FP micro-ops for execution readiness every cycle, but Wong’s thesis shows selecting older instructions for execution first is optimal anyway. Thus, Zen 2 can have an impressive 192 micro-ops waiting for execution in the backend, without having a scheduler that large.
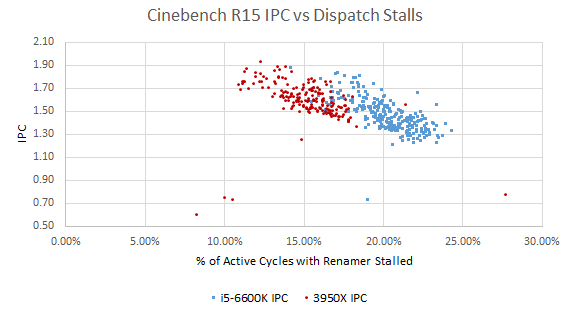
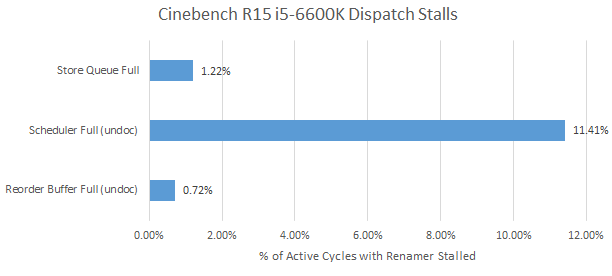
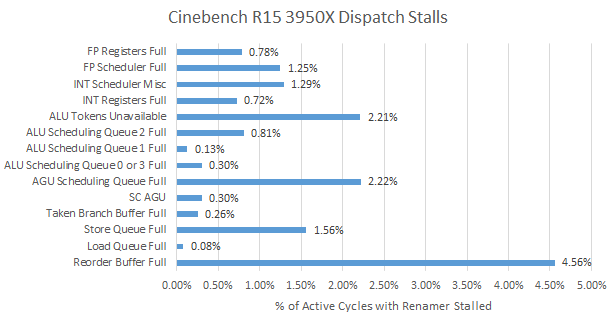
Skylake ends up being backend bound for 20.1% of cycles compared to Zen 2’s 15.1%. Based on a performance event unit mask that went undocumented after Haswell (so take this with a grain of salt), Skylake’s unified scheduler is responsible for more than half the stalls. Zen 2’s scheduler accounts for less than a third of backend-bound renamer stalls. In Intel’s favor, Skylake’s larger store queue fills up less than Zen 2’s. But both CPUs suffer few stalls from a full store queue in this benchmark.
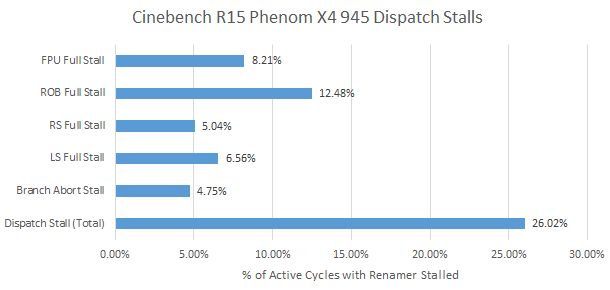
Jumping back a decade, we can see how much the non-scheduling queue helps. AMD’s K10 architecture also has a 36 entry floating point scheduler, but suffers significantly more FPU resource related stalls. I’m sure FPU resources would be responsible for even more renamer stalls if Phenom’s small reorder buffer didn’t fill first. On Intel’s side, Tremont uses a distributed scheduler and introduces micro-op overflow buffers for floating point and memory scheduling queues. That hints at how useful overflow buffers are.
Zen 2 occasionally stalls on a full memory/AGU scheduling queue and a full reorder buffer, hinting that it can’t always hide cache latency. Divides make up about 0.5% of the instruction stream. Those could contribute to ROB full stalls too, since division tends to be high latency.
Data-Side Caching: AMD’s Larger L2 Wins
Unforunately, Zen 2 and Skylake do not provide comparable performance monitoring events for tracking data load sources. Skylake updates performance counters for load data sources when it commits instruction results. Zen 2’s performance counters directly track cache hits and misses at the load/store unit, so all speculative accesses are counted. The definition of a L1D cache miss is also not straightforward. Zen 2 will only count one L1D miss per 64B cache line, since only one cache line has to be filled into L1D. Skylake can track how often a load requested data that there’s already an outstanding L1D miss for (fill buffer hit). But to keep things simple, we’ll just look at the number of L1D refills for both.
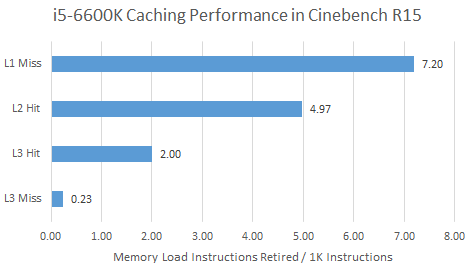
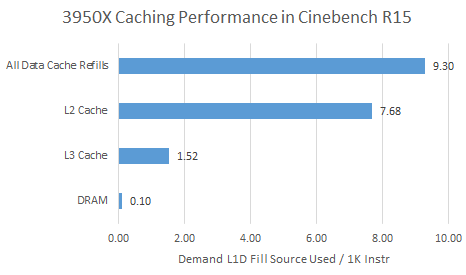
Zen 2’s higher L2 hitrate means it suffers L3 latency less than Skylake, placing less strain on the execution engine’s queue capacity. More memory requests served at lower latency means fewer stalls due to backend queues filling up. Impressively, Zen 2’s 512 KB L2 has 12 cycles of latency just like Skylake’s smaller 256 KB cache.
Zen 2’s giant L3 cache means it goes to memory less than half as often as Skylake does. L3 misses are rare on both architectures, so cache performance is more important than DRAM performance here.
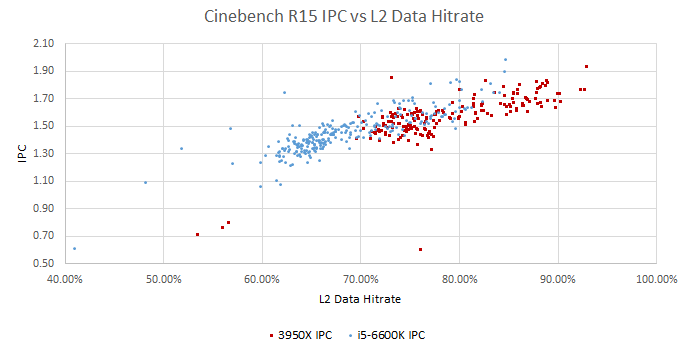
L2 performance counter events are more comparable. Both Zen 2 and Skylake can count speculative L2 accesses. Zen 2 clearly gets higher hitrate, and there’s a positive correlation between L2 hitrate and IPC for both CPUs.
Big L2 Helps Code Fetches Too
The L2 cache on both CPUs must split capacity between code and data. Arguably, the code side is even more important, because the in-order frontend can’t hide latency as well as the out-of-order backend.
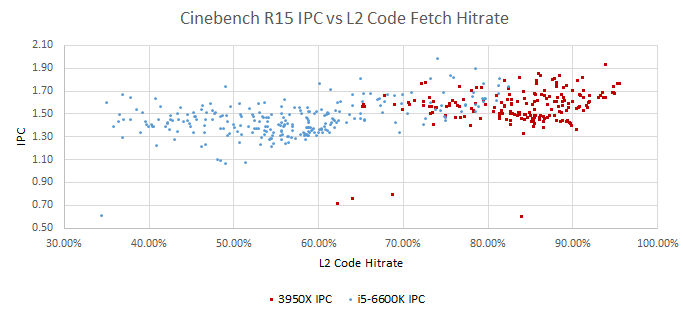
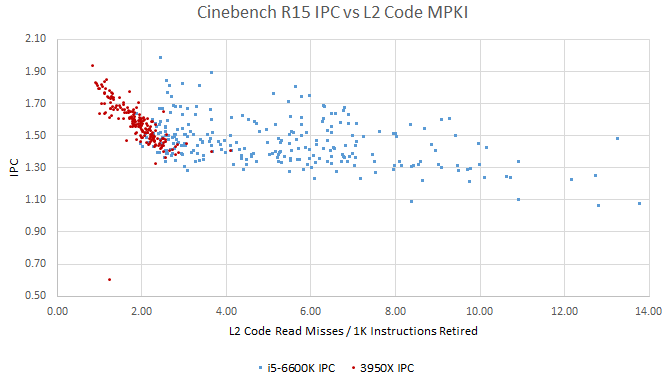
Both CPUs benefit when L2 catches L1i misses. The correlation is clear for Zen 2 when misses are normalized for instruction count. I’m not sure what’s going on with Skylake, where points are all over the place and the correlation is weaker. Perhaps more backend resource stalls on Skylake mean the frontend isn’t as important.
Conclusion
With Zen 2, AMD has surpassed Intel for the first time in a lot of important areas. Intel’s historical branch predictor advantage has completely evaporated. The same applies to the execution engine’s latency absorbing abilities. Finally, AMD’s superior caches wrap things up to give Zen 2 a measurable advantage in Cinebench R15.
In fairness to Intel, CBR15 doesn’t heavily exercise the memory controller, where Intel’s monolithic design gives it lower latency to memory. Intel’s core also has some strengths, like a larger store buffer and higher op cache/L1i hitrates. Finally, Skylake will soon be superseded on desktop by Rocket Lake (RKL). RKL matches Zen 2’s L2 capacity, dramatically increases the number of scheduler entries, and may improve the branch predictor as well.
Appendix: What Didn’t Matter (Much)
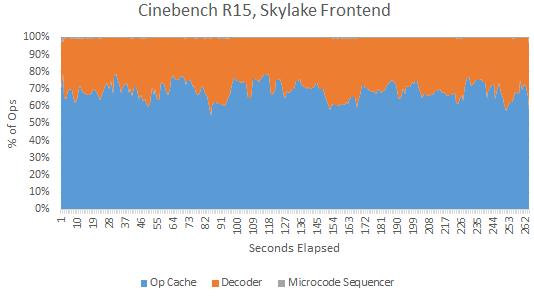
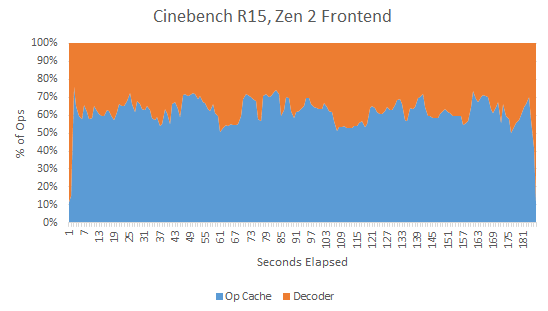
Frontend Bandwidth
Once the branch predictor has provided the next fetch address, the frontend must get instructions at that address to the core. Frontend bandwidth can matter for high IPC code, where the main challenge is feeding the backend with instructions. Both Zen 2 and Skylake can do this through two main paths. X86 instructions can be fetched from the L1 instruction cache and decoded into internal operations (micro-ops, or ops for short). Both architectures also keep a cache of ops. Hitting the op cache lets the CPU bypass the decoders, increasing instruction bandwidth while saving power and reducing branch mispredict penalties. Surprisingly, Skylake’s smaller 1536 entry op cache has a higher hitrate (69.1%) than Zen 2’s 4096 entry op cache (62.7%).
Skylake’s higher op cache hitrate may be explained by a smarter replacement policy. From my testing, Zen 2’s op cache hitrate sharply drops to near zero after a loop exceeds its capacity. Skylake sees a much softer drop off. Skylake may also be fetching more incorrect paths from its op cache due to branch mispredicts.
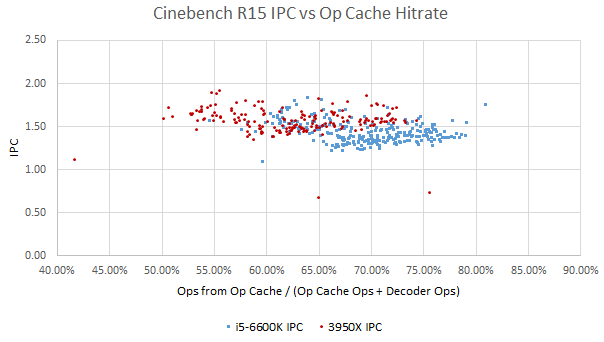
Op cache hitrate and IPC is weakly correlated at best. Frontend bandwidth doesn’t look like a bottleneck in either architecture. That’s expected in Cinebench R15, where IPC isn’t particularly high.
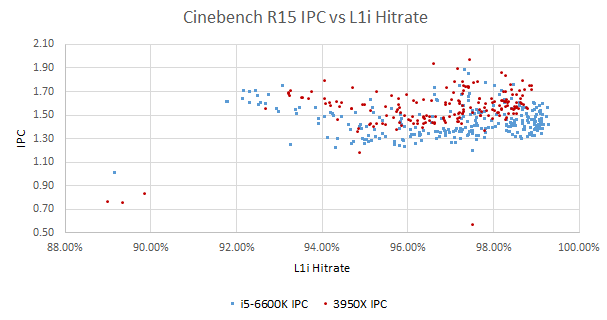
Instruction fetch latency can be a problem if we get a lot of L1i misses. But the correlation here looks weak too, with a curious V-like pattern where portions of the benchmark with lower L1i hitrate actually get better IPC. Plotting L1i misses per instruction instead of hitrate doesn’t change the picture much. We don’t see instruction cache misses strongly affect IPC until L2 is missed as well (as discussed above). Perhaps both CPUs have deep enough frontend queues to absorb the latency of a L2 hit.
Execution Resources
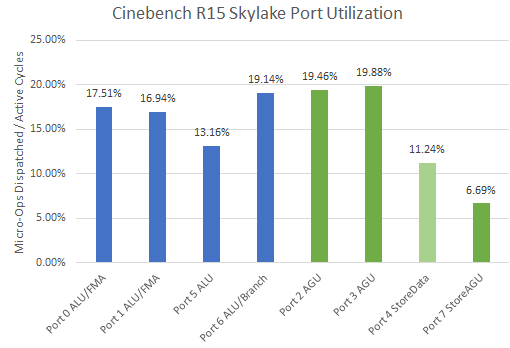
Execution port capacity isn’t a problem on Skylake. Utilization on all ports is very low, which is no surprise because Cinebench R15 isn’t a high IPC load. Notably, floating point ports see lower utilization than ones handling memory or branches.
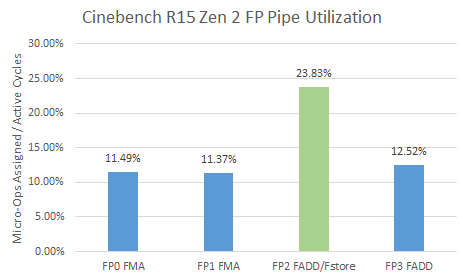
With Zen 2, AMD no longer documents any port utilization counters. However, Zen 1 events that count when micro-ops are assigned to FP pipes still appear to work on Zen 2. I tested with some snippets of FP/vector integer code, and they still count correctly. From those counters, Zen 2 sees low FP pipe utilization as well. FP pipe 2 is the only pipe that can handle floating point and SIMD stores, which explains higher utilization there. Many of the SSE instructions in Cinebench load and store data, rather than doing math. But it’s still far from being a bottleneck.
AMD doesn’t have any counters for integer-side pipe utilization or assignment. But Zen 2’s integer execution cluster is broadly similar to Skylake’s, so we can infer that Zen 2 doesn’t have any execution capacity issues on the integer side. Finally, the lack of stalls on per-port scheduling queues filling up implies that there’s no drastically uneven distribution of micro-ops to ports.