
Core to Core Latency Data on Large Systems

Multicore CPUs have to give user programs a way to synchronize between different cores, and ensure a coherent view of memory. A write from one core has to be made visible to others, even though each core has private caches. Cache coherency protocols like MESI, MESIF, or MOESI help make sure this happens. They’re typically used with a snoop filter to reduce how often cores get asked if they have a certain line cached. We can measure how long a system takes to bounce a cacheline between cores by using atomic compare and exchange operations.
Large server and workstation systems are an especially interesting case because high core counts make it harder to efficiently handle cross-core communication. More cores mean more potential clients for an interconnect to snoop. High core count systems tend to deal with longer physical distances as well, because chips with a lot of cores tend to be big. And sometimes, getting the core count you want involves multiple sockets.
This post will be light on commentary and focus on providing a lot of data. Some of the CPUs tested here have been previously covered in more detailed articles. Some have not, but inclusion of data here doesn’t mean they’ll be covered in the future.
Results should be roughly comparable to core to core latency test used by Anandtech. The exact implementation differs, but we’re testing the same thing. Keep in mind core to core traffic will typically be far lower than traffic to L3 and memory, so expect the figures here to have minimal impact on performance (unless they’re egregiously bad). Finally, results with SMT-enabled cores will be presented with Windows-style core numberings, where SMT siblings are adjacent. Linux numbers SMT logical cores differently, and mixing the two will make things very confusing.
Intel’s Sapphire Rapids
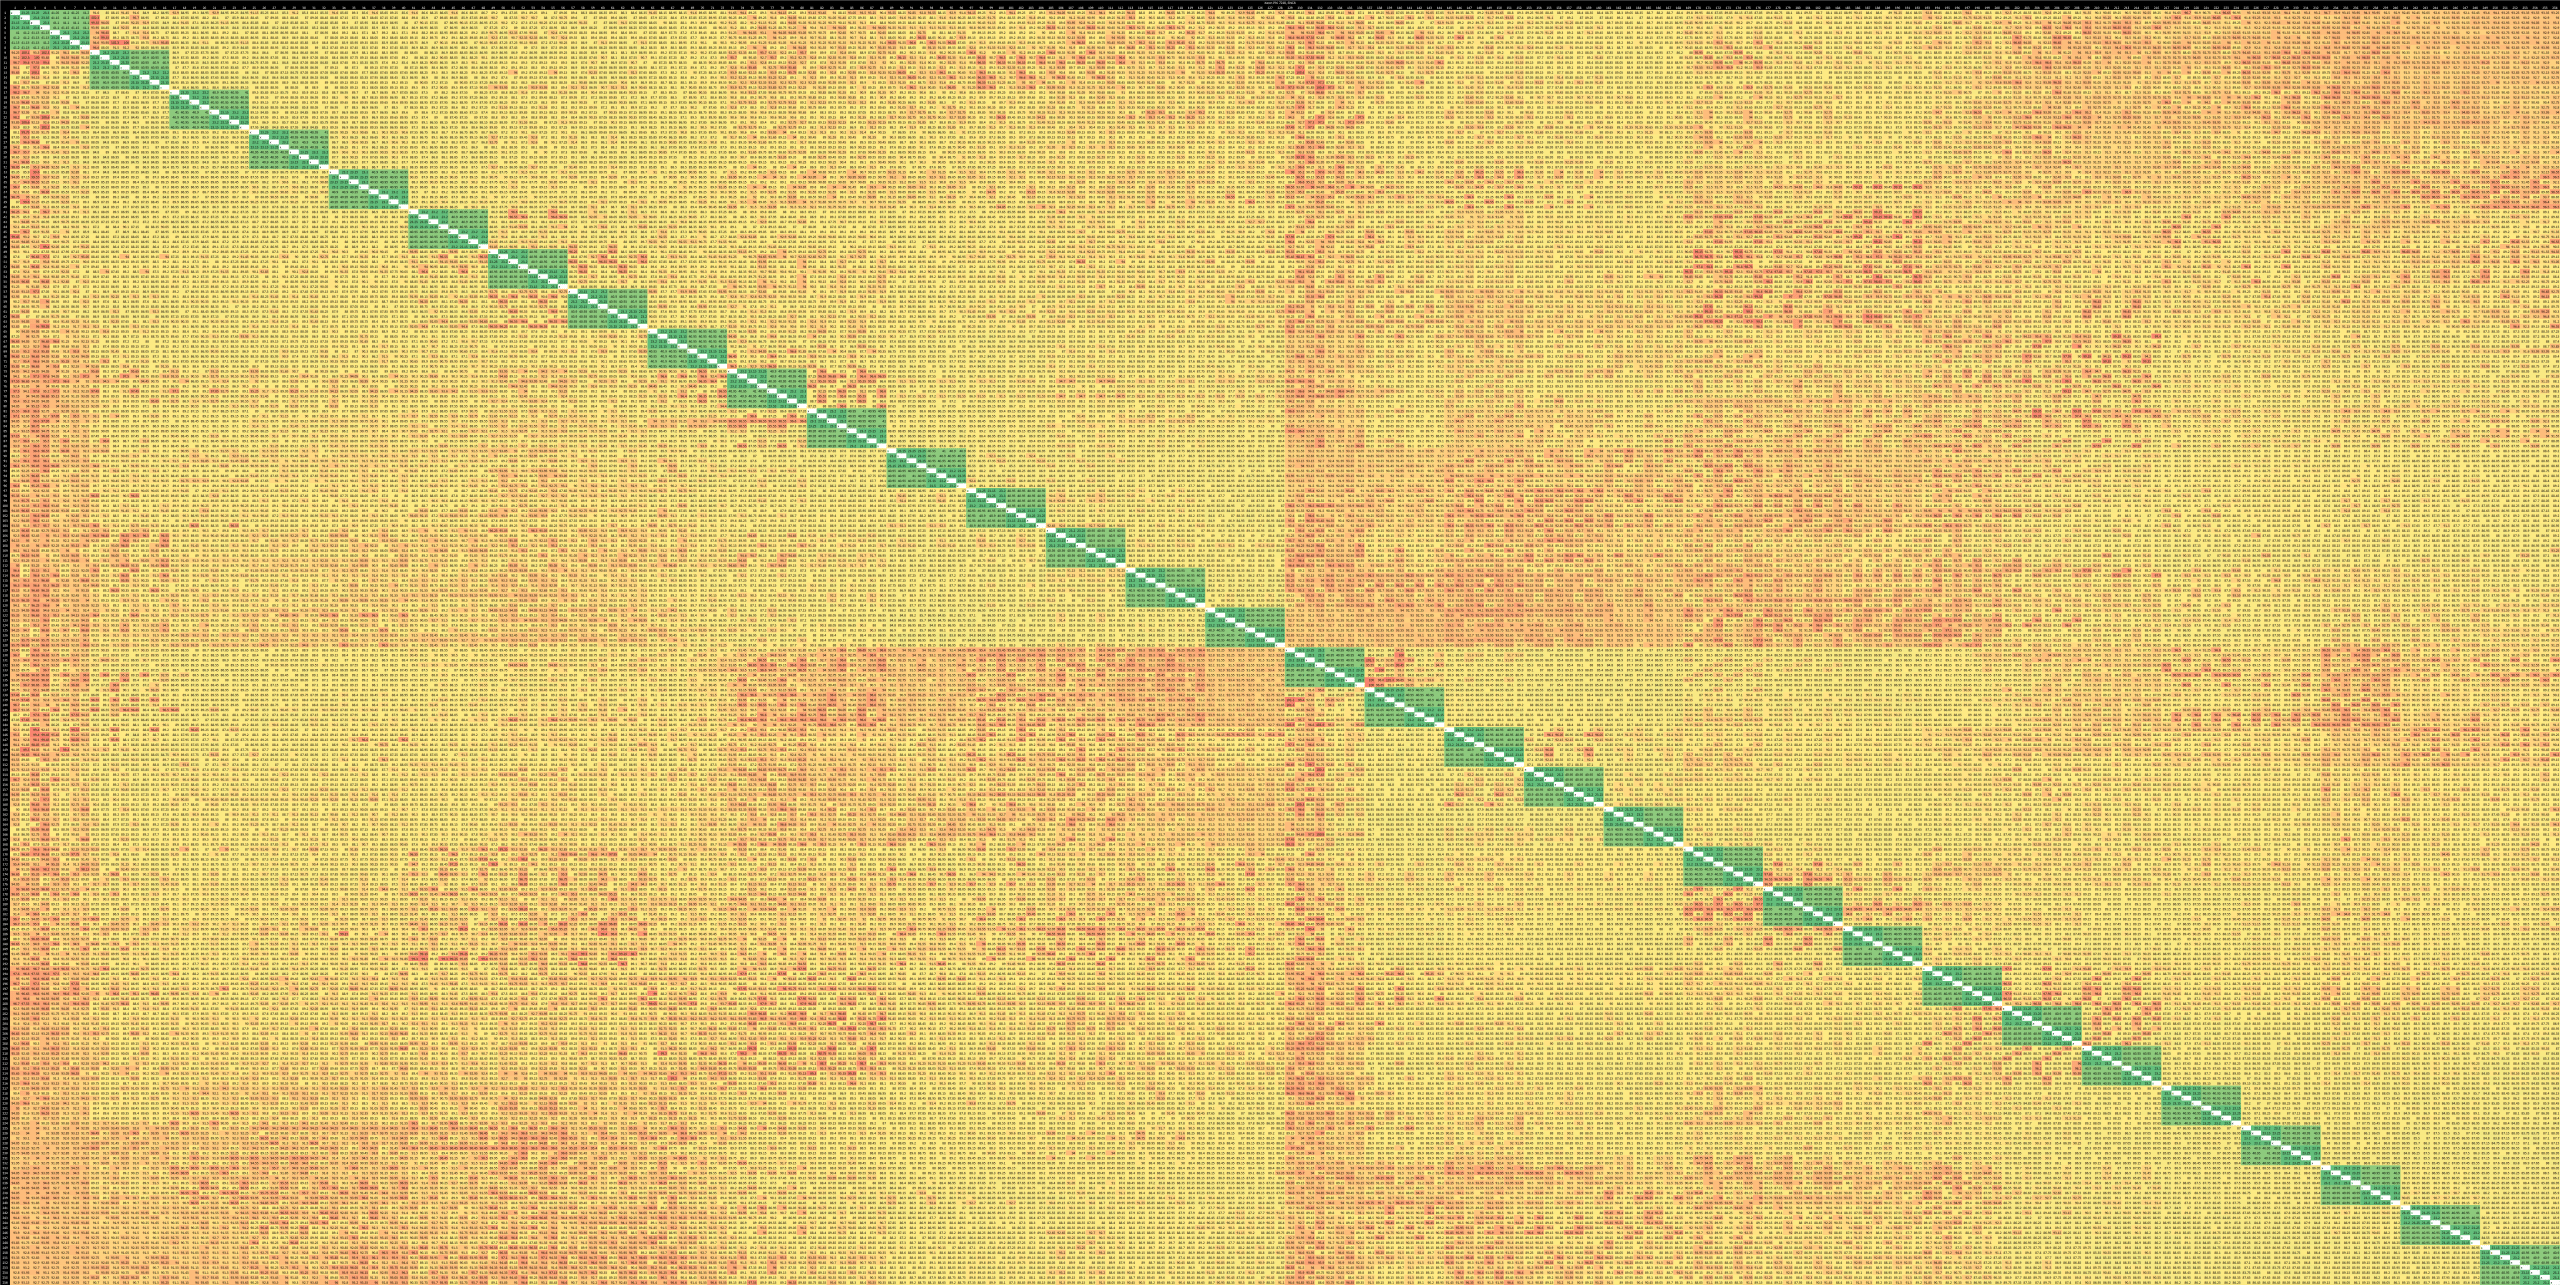
Sapphire Rapids (SPR) is Intel’s latest server architecture, developed with the Golden Cove architecture as a foundation. A full SPR chip features four dies connected with EMIB links. Average core to core latency within a socket is 59 ns, while cross socket transfers average 138 ns latency.
Within a socket, groups of four cores tend to share similar characteristics. Worst case latency within a socket is 81 ns.

AMD’s Genoa-X
Genoa-X is the VCache enabled version of AMD’s Zen 4 based server architecture. We previously covered Genoa-X, but the core to core results are duplicated here for a quick comparison to Sapphire Rapids.
Genoa handles coherency at the CCX level and at the system level. A CCX can cache a line homed to a remote socket and keep track of it for cores within that cluster. However, cross-CCX accesses are handled by the socket that owns the cacheline.
Amazon’s Graviton 3
Graviton 3 is a custom Amazon chip that implements 64 Neoverse V1 cores. These cores sit on a monolithic die, while memory controllers get their own chiplets.

Average latency is 48 ns, and latency stays below 59 ns across the entire chip. Unlike Sapphire Rapids, Graviton 3 does not support coherent cross-socket accesses, and the largest available Graviton 3 instance tops out at 64 cores.
Amazon’s Graviton 2
Graviton 2 implements 64 Neoverse N1 cores on a monolithic die. It acts a lot like Graviton 3, but latencies are a tad higher with an average of 50.7 ns.

Intel’s Skylake
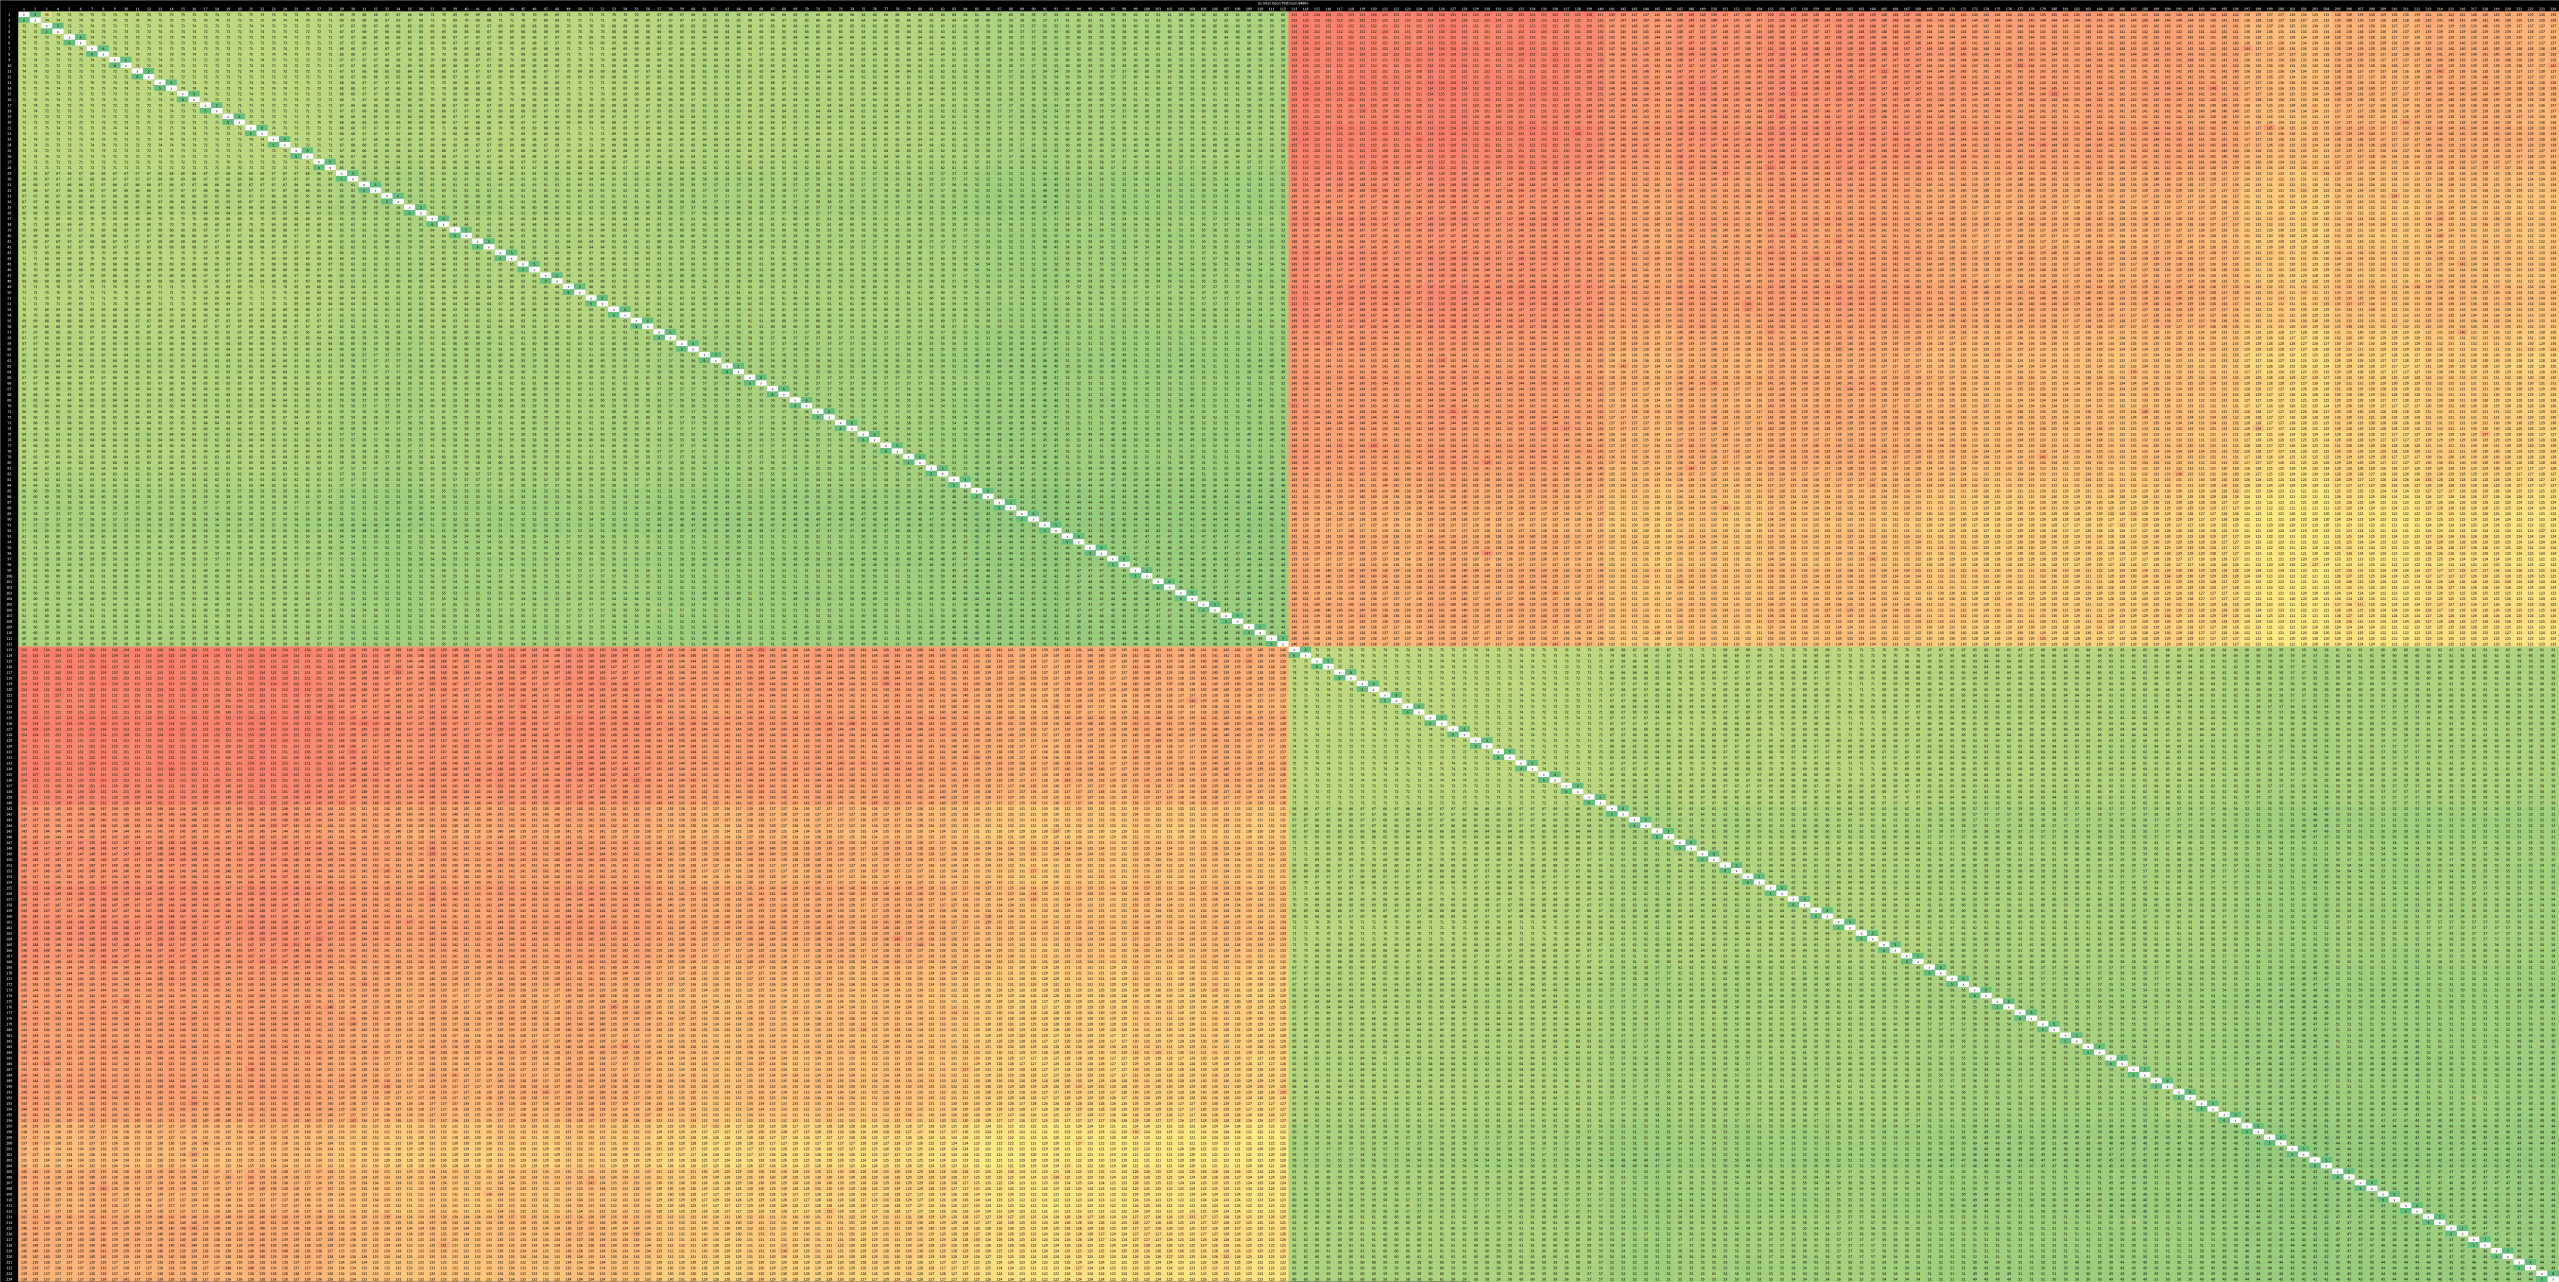
Server Skylake is notable for being Intel’s first go at a mesh interconnect. Server Skylake cores are quite large, thanks to an all-out AVX-512 implementation and 14 nm not being particularly good in comparison to today’s process nodes. Therefore, you need more sockets if you want a lot of cores. This result comes from a quad socket system.
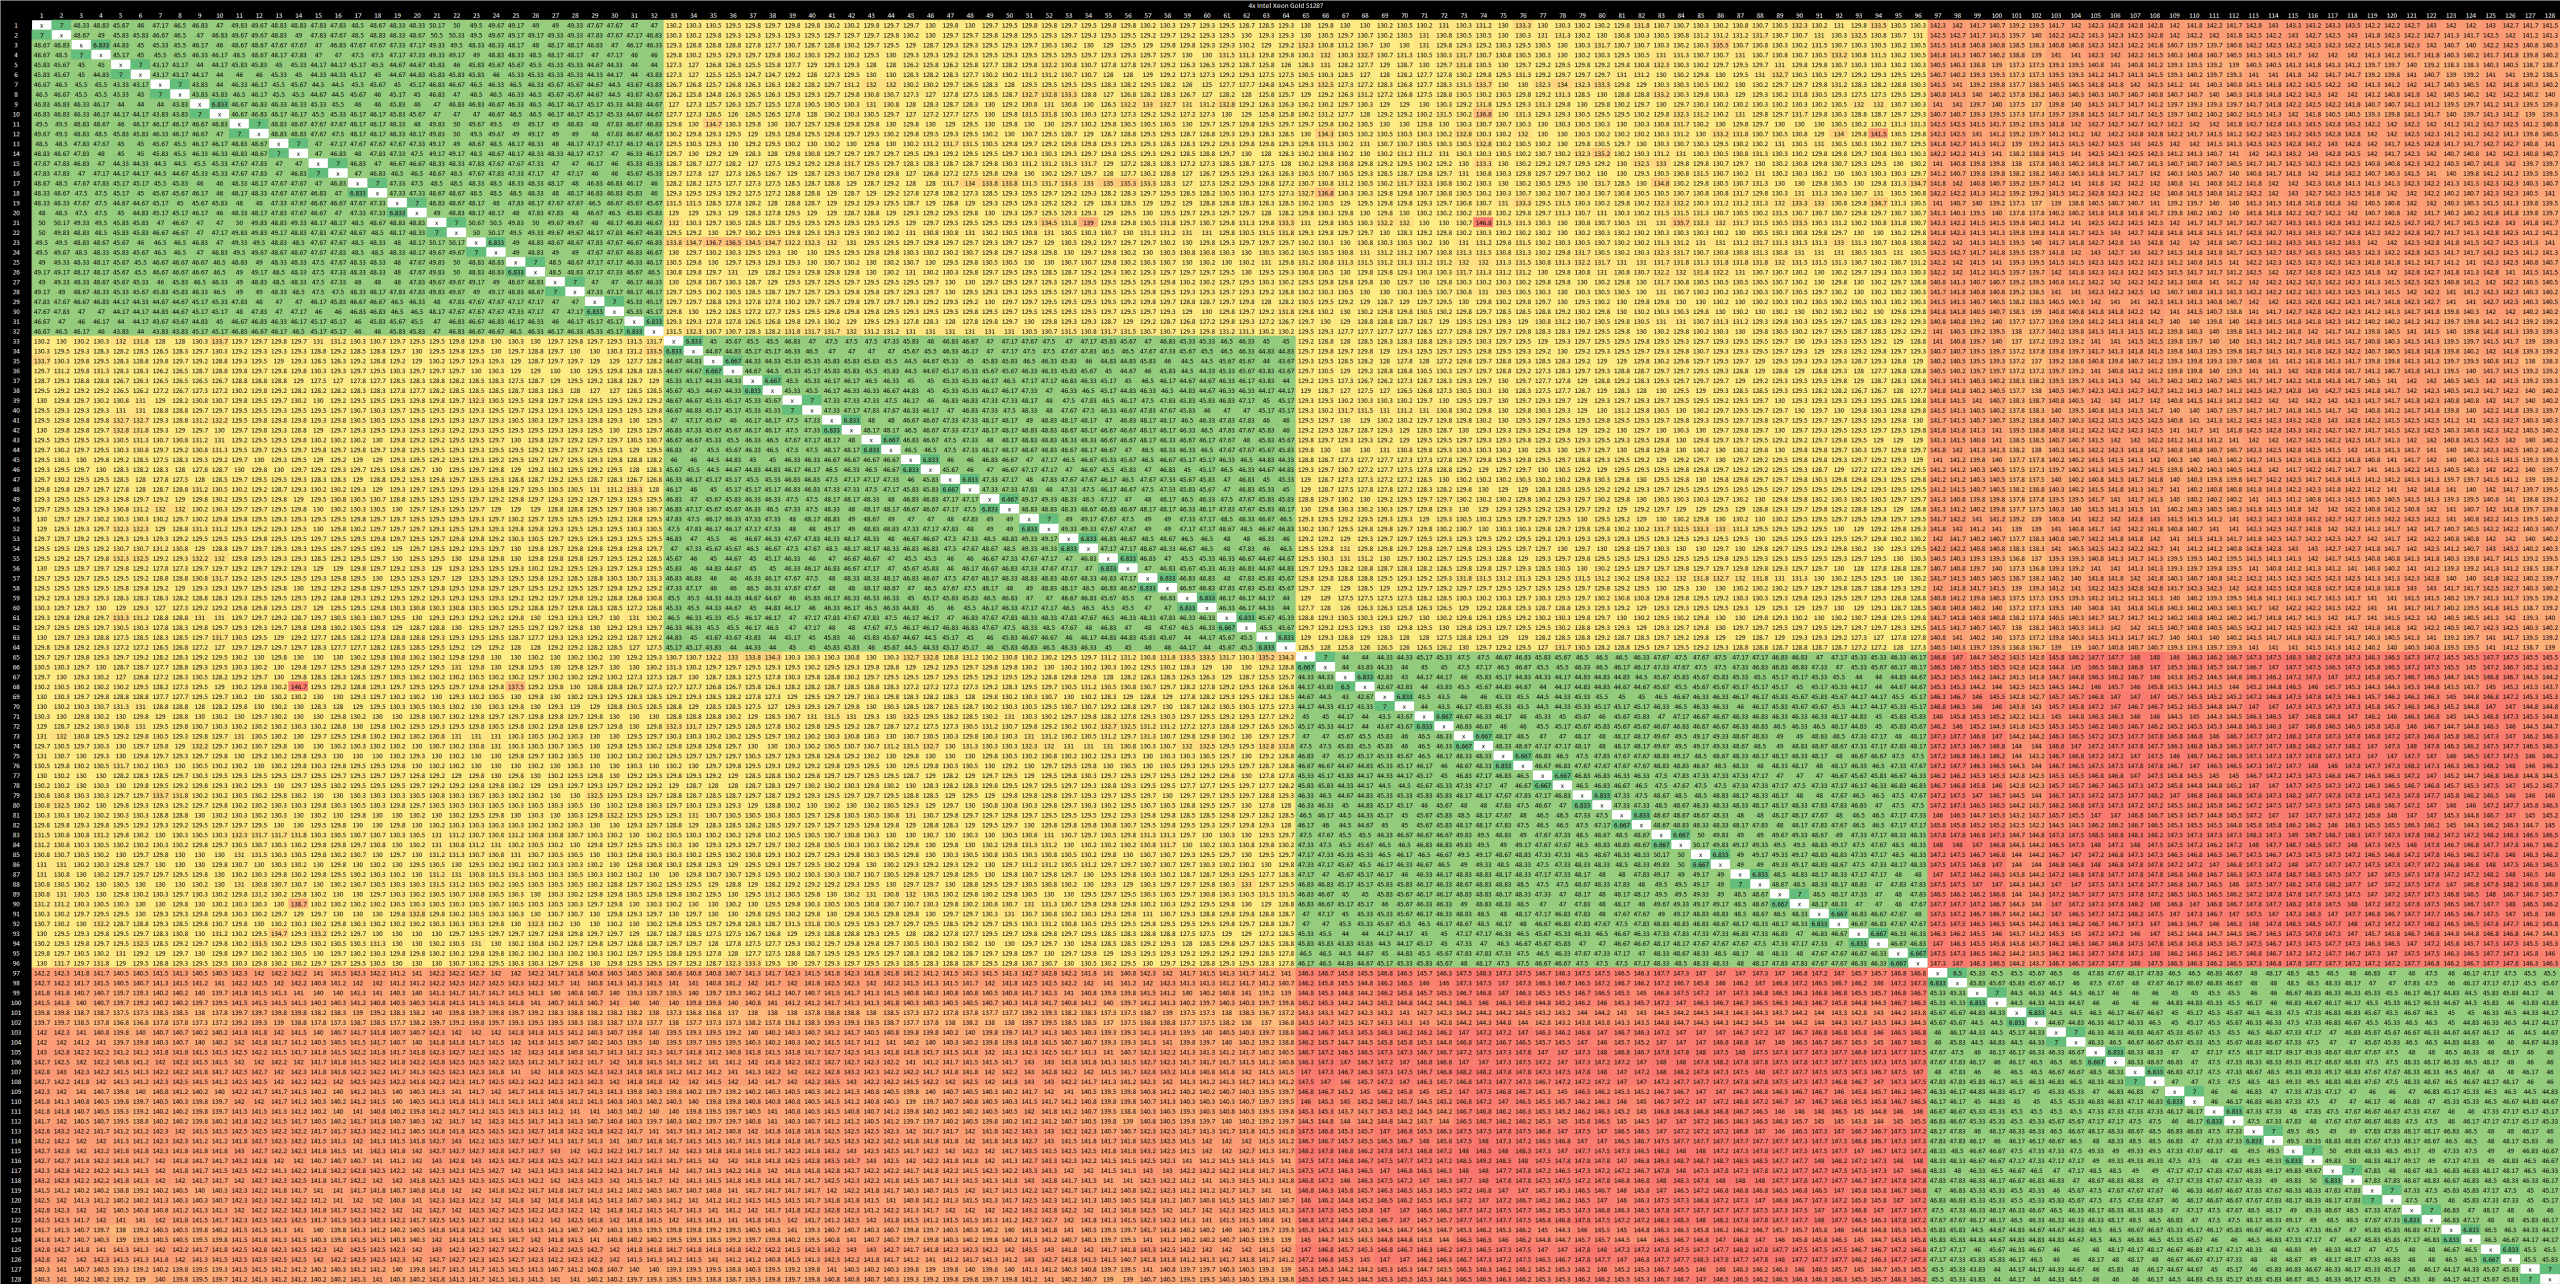
As with other designs, latency depends on whether a cacheline is homed. In this case, the first socket appears to own the line, and the fourth socket seems to be the farthest away from the first one. Cross-socket latencies max out at 150 ns, which is a decent showing considering how many sockets are involved.

Latencies within a socket are typical for a mesh, with an average of 47 ns. As with Sapphire Rapids, groups of cores share similar latency characteristics.
If we apply color scales to focus on intra-socket latencies, the pattern is slightly different with each socket. That suggests different Skylake chips have different core numberings or address to L3 slice mappings.

Intel’s Broadwell
Broadwell came before Skylake, and is a 14nm die shrink of Intel’s 22nm Haswell architecture. Unlike Haswell, Broadwell never made a significant impact in the client market and was relegated to special purpose chips like the eDRAM equipped i7-5775C. Broadwell also saw limited use in HEDT chips until AMD’s Zen gave it stiff competition in that market too.
However, Broadwell saw plenty of use in the server market. There, a dual ring setup allowed Intel to keep core scaling going. Cross socket latency is improved over Sandy Bridge, with around 130 ns of worst case latency.
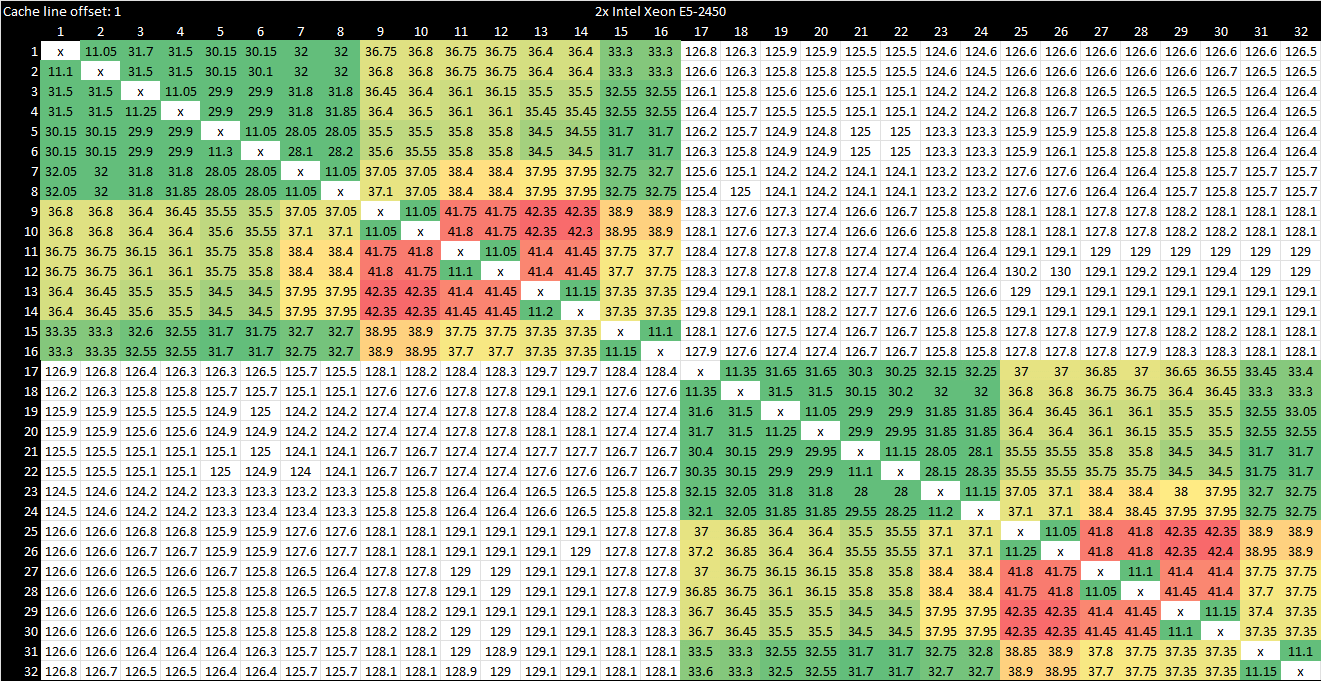
Recall that core to core latency depends heavily on where a cacheline is homed to. A request from a core will be routed to a L3 slice based on the memory address its seeking to access. From there, the L3 slice can make a request to another core depending on what the core valid bits show. Intel stripes accesses across slices to avoid partition camping, where many cores smack one L3 slice and end up facing contention. Since accesses typically have nice spatial locality, it’d make a lot of sense to put adjacent cachelines on different slices.
We can take advantage of this by offsetting the tested cacheline relative to a page boundary, and get a different L3 slice to own it.
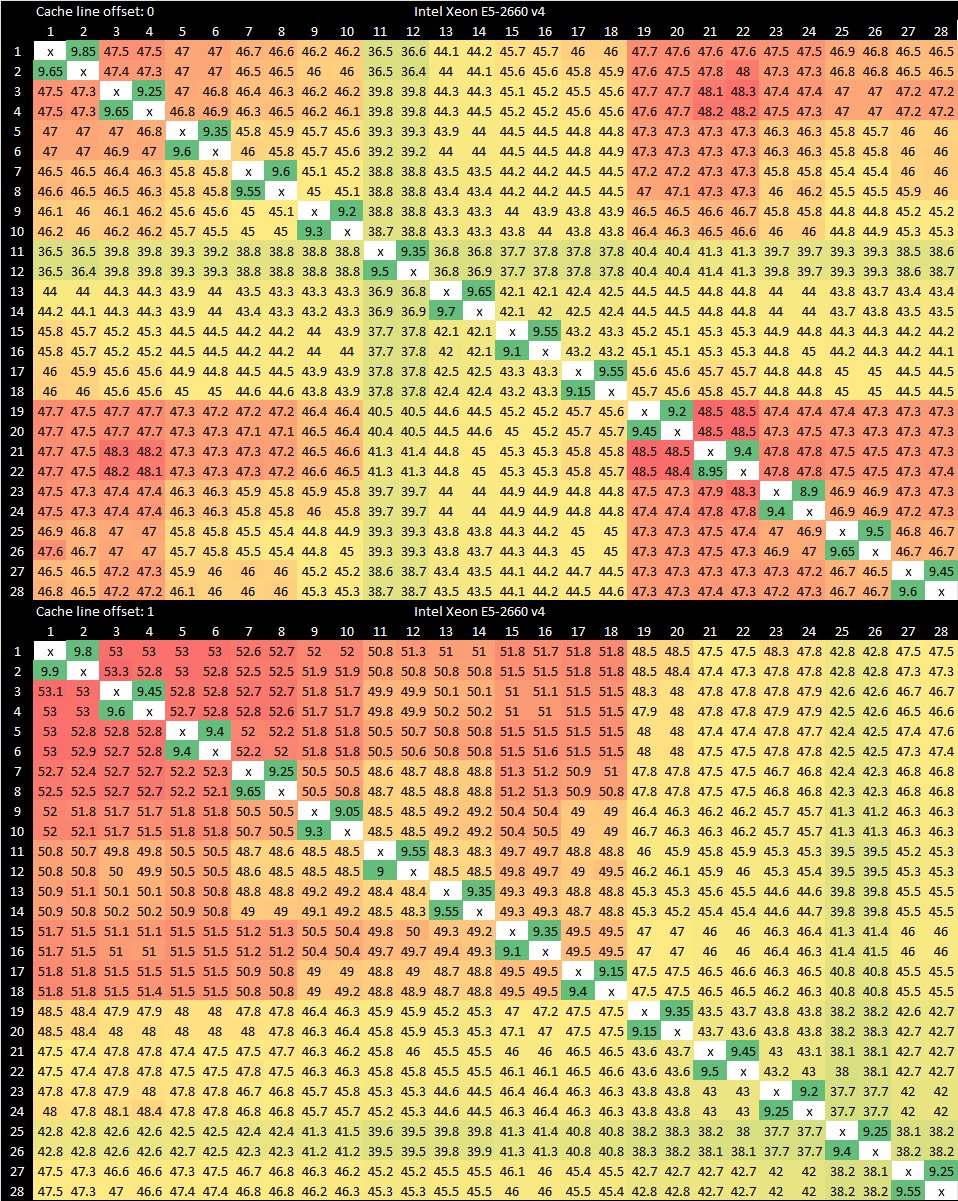
Broadwell’s dual ring configuration offers latencies similar to that of Skylake’s mesh, but with better best-case latencies and comparable worst case ones.
Server Broadwell chips can also be configured in “cluster on die” mode, which effectively makes each ring a core cluster with a private L3 and memory controller. In this mode, intra-cluster core to core latency is excellent at under 50 ns. Cross cluster accesses within a socket go slightly above 100 ns, and cross socket accesses take just a bit longer. That suggests a lot of the latency overhead is in going to the home agents (tied to memory controllers) instead of handling coherency at the L3.
Furthermore, address to L3 slice position mappings appear to be identical for each cluster, as do core numberings. Applying color scales just to intra-cluster accesses highlights this.
Intel’s Sandy Bridge
Like Nehalem, Sandy Bridge enjoys massive improvements in interconnect design. A Sandy Bridge chip implements up to eight cores on a ring interconnect, and supports multi-socket setups via QPI.

Cross-socket accesses see variable latency ranging from 142 to 232 ns. This is a regression compared to Nehalem, but Sandy Bridge is able to maintain very good intra-socket latency while supporting more cores per socket.
Moving the tested cacheline around and restricting coloring to each socket shows the address to L3 slice mapping remains consistent across both sockets.
Intel’s Westmere
Westmere is the 32nm die shrink of Intel’s 45 nm Nehalem architecture. Nehalem represented a massive leap in Intel’s multicore design. It ditches the Front Side Bus (FSB) interconnect in favor of a crossbar (Global Queue) for intra-socket communication. Cross-socket communication is handled by QuickPath Interconnect (QPI), a point-to-point link that’s somewhat similar to AMD’s HyperTransport.
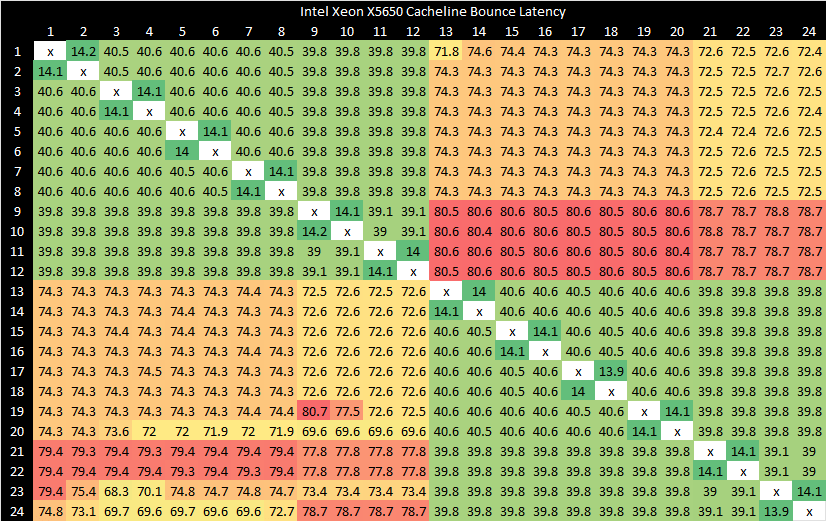
QPI replaced Intel’s old FSB interface, and cross-socket communication happens very quickly. In fact, cross-socket latencies are comparable to the worst case intra-socket latencies on Sapphire Rapids.
Intel’s Dunnington
Dunnington was Intel’s first attempt to really scale out per-socket core counts. It was based on the Core 2 Penryn architecture, and combined three dual core clusters with a L3 cache. Dunnington’s northbridge enabled quad socket setups by exposing four FSBs.

Coherency is handled first within a socket, with core-valid bits within the L3 cache. At the system level, the northbridge uses probe filters to handle coherency and avoid broadcasting snoops. Although sibling cores share a L2 cache, there’s no probe filter at that level.
Dunnington takes the dated FSB architecture drags it along as far as it can possibly go, while employing some spectacular engineering to work around its limitations. However, latencies were high and bandwidth was low. Intel’s QPI was a massive improvement, and finally enabled them to catch AMD in the high core count, multi-socket arena.
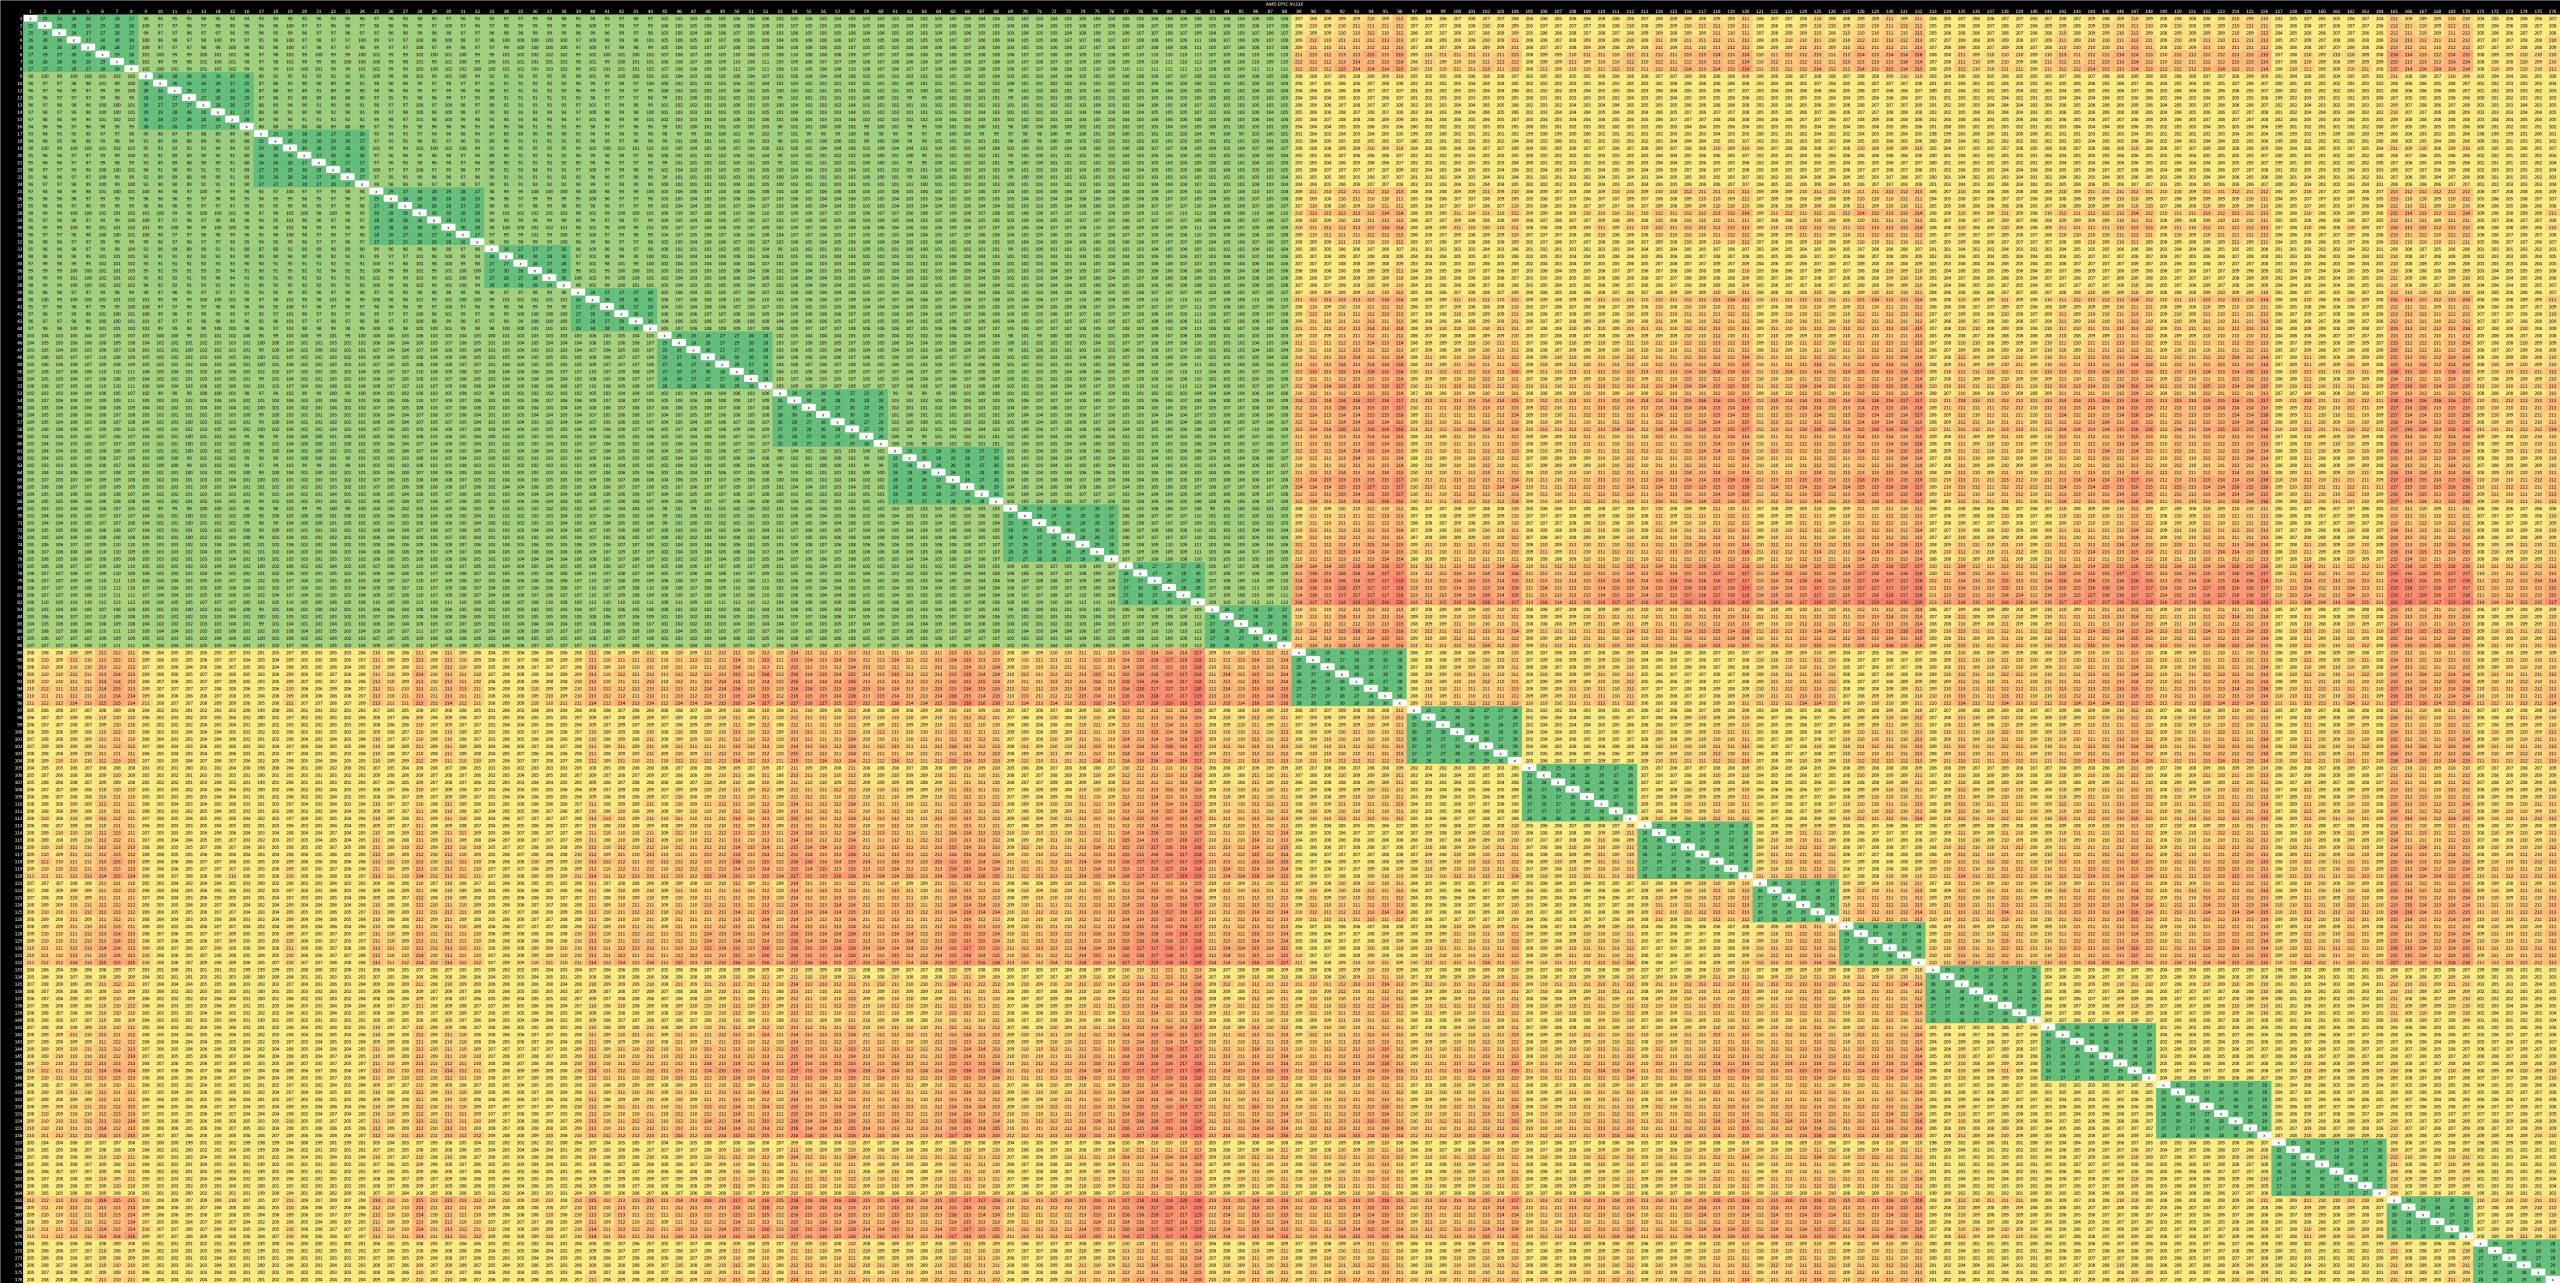
AMD’s Magny Cours (K10 Server)
In the mid 2000s, AMD was a strong contender in the server market thanks to their HyperTransport cross-socket links. AMD’s Opteron 6180 features six K10 cores per die, and places two dies in the same package. Cores within the same die are linked by a two-level crossbar system. A System Request Interface connects cores to each other and the L3 cache. Then, a crossbar (dubbed XBAR by AMD) links that to the memory controller and HyperTransport links. HyperTransport connects the dies to each other, and to IO.
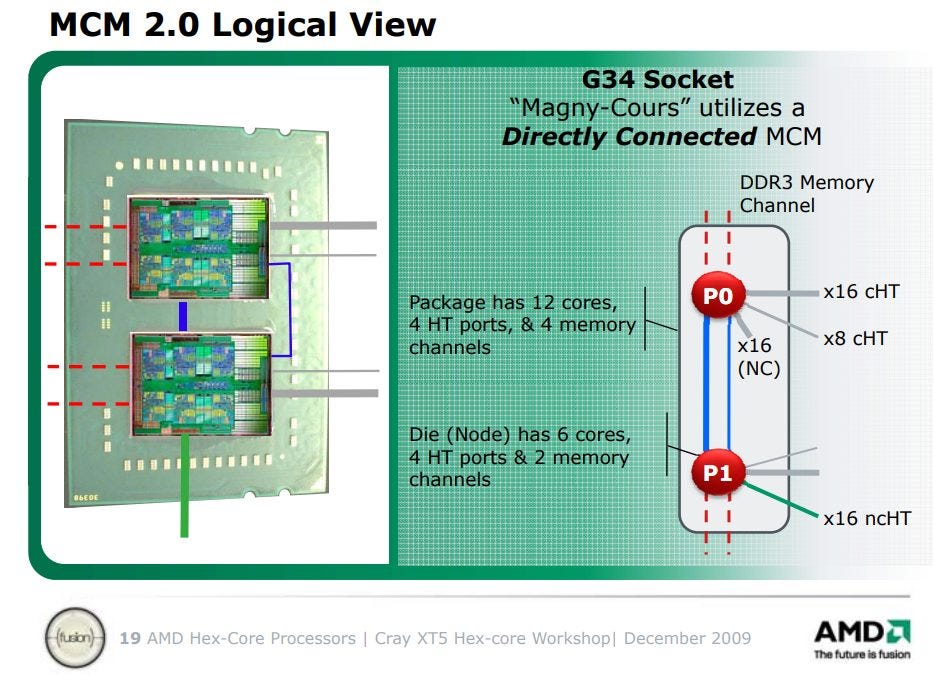
A dual socket configuration has four dies, each of which is its own NUMA node. Latencies again depend on where the tested cacheline is homed. Unlike modern Intel multi-socket systems, coherency operations require a round trip to the owning socket.

Worst case >130 ns latencies can probably be explained by having to cross socket boundaries twice. That is:

AMD’s worst case latency is still significantly better than Dunnington’s, even though the system manages the same core count. Unfortunately, Intel had Nehalem and QPI to compete.
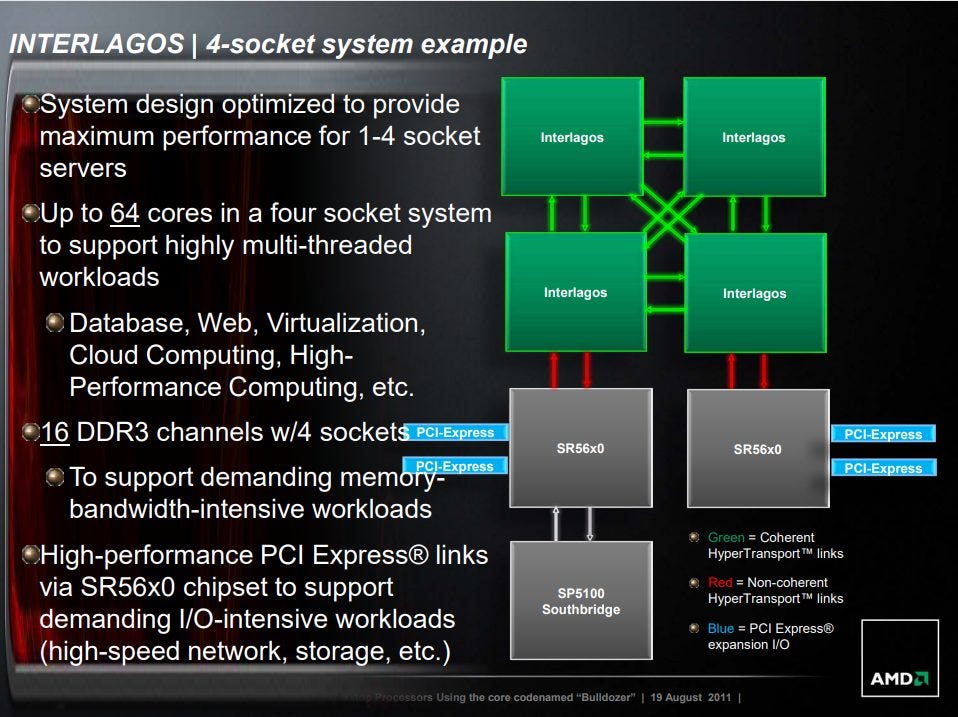
AMD’s Abu Dhabi (Piledriver Server)
Piledriver is the second generation of AMD’s clustered multithreading architecture, where sibling threads share a L2 cache, frontend, and FPU, but have private integer and load/store units. Piledriver’s server variant puts two 8t/4m dies on a single package, and supports cross-socket coherency via HyperTransport.

Sibling threads enjoy acceptable cross-thread communication latency. Cross-module accesses are a bit slower, and cross-socket accesses impose a further penalty. Going between sockets is generally acceptable, but one die on the second socket appears to be much farther away.
Piledriver could scale to even higher core counts with quad socket configurations.
With a quad socket setup, we see a similar pattern within each die. Pairs of dies on the same socket enjoy slightly lower latency, and have adjacent core numbering.
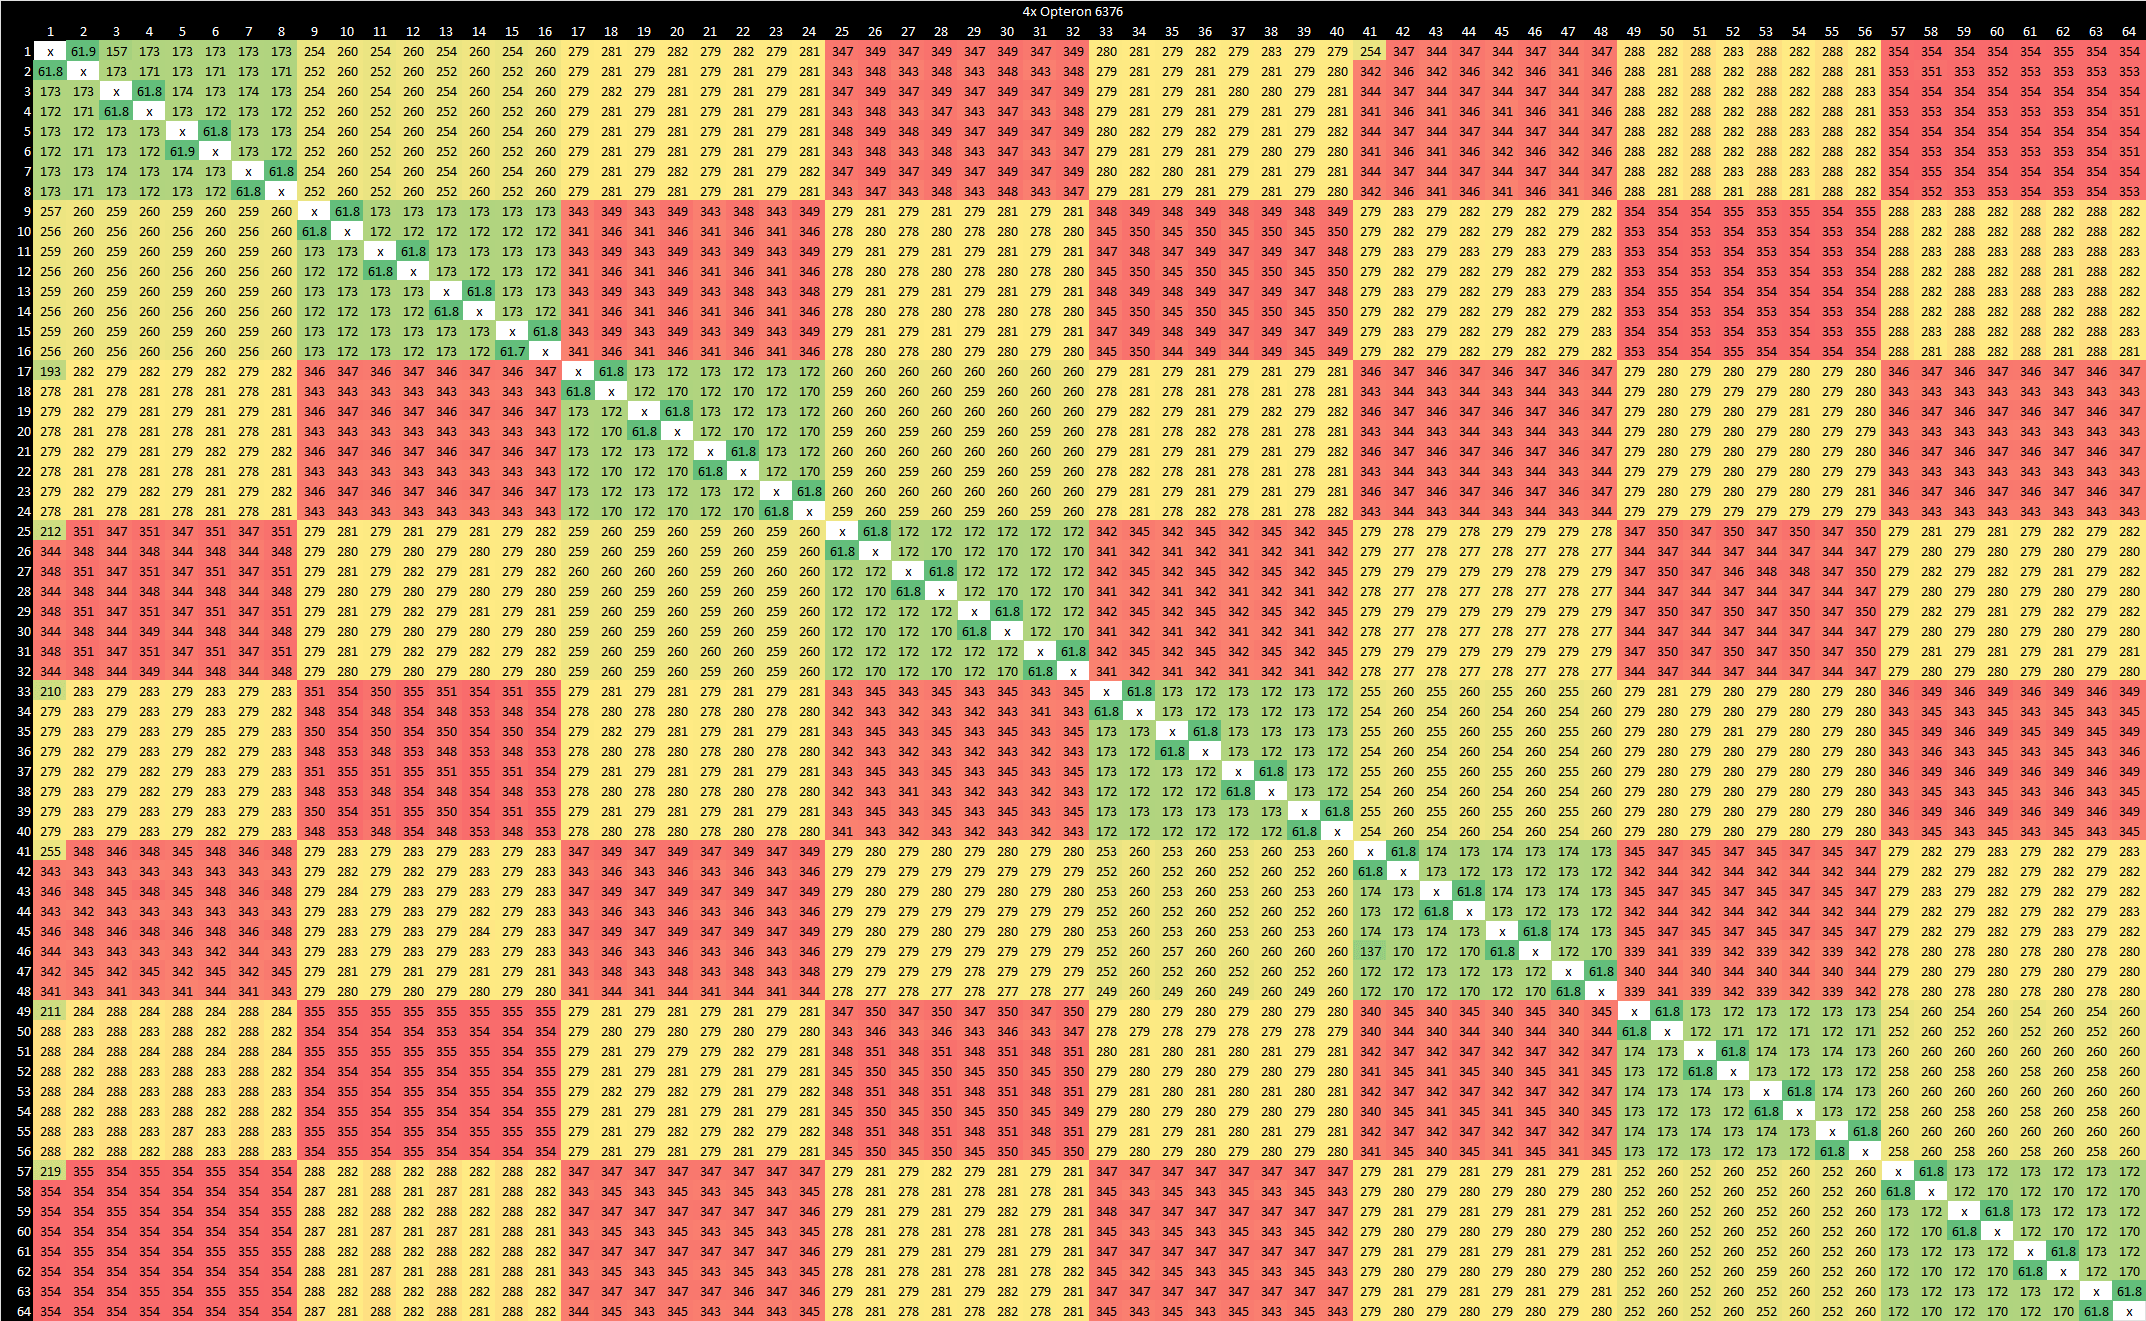
Worst case latency is just under 350 ns, and likely happens when cross socket communication has to go through a sibling die before reaching the destination.
IBM’s POWER8
IBM’s POWER line has a long history of use in servers, although it has been eclipsed by Intel and AMD’s offerings. The POWER8 based E880 implements 6 to 12 cores, each of which supports 8-way SMT. Multi-socket setups are supported, and POWER8 can even handle coherent accesses across server nodes. Results from IBM cloud are confusing and any extended testing is prohibitively expensive. Also, the E880 no longer seems to be available on IBM’s cloud. Data is presented here as-is.
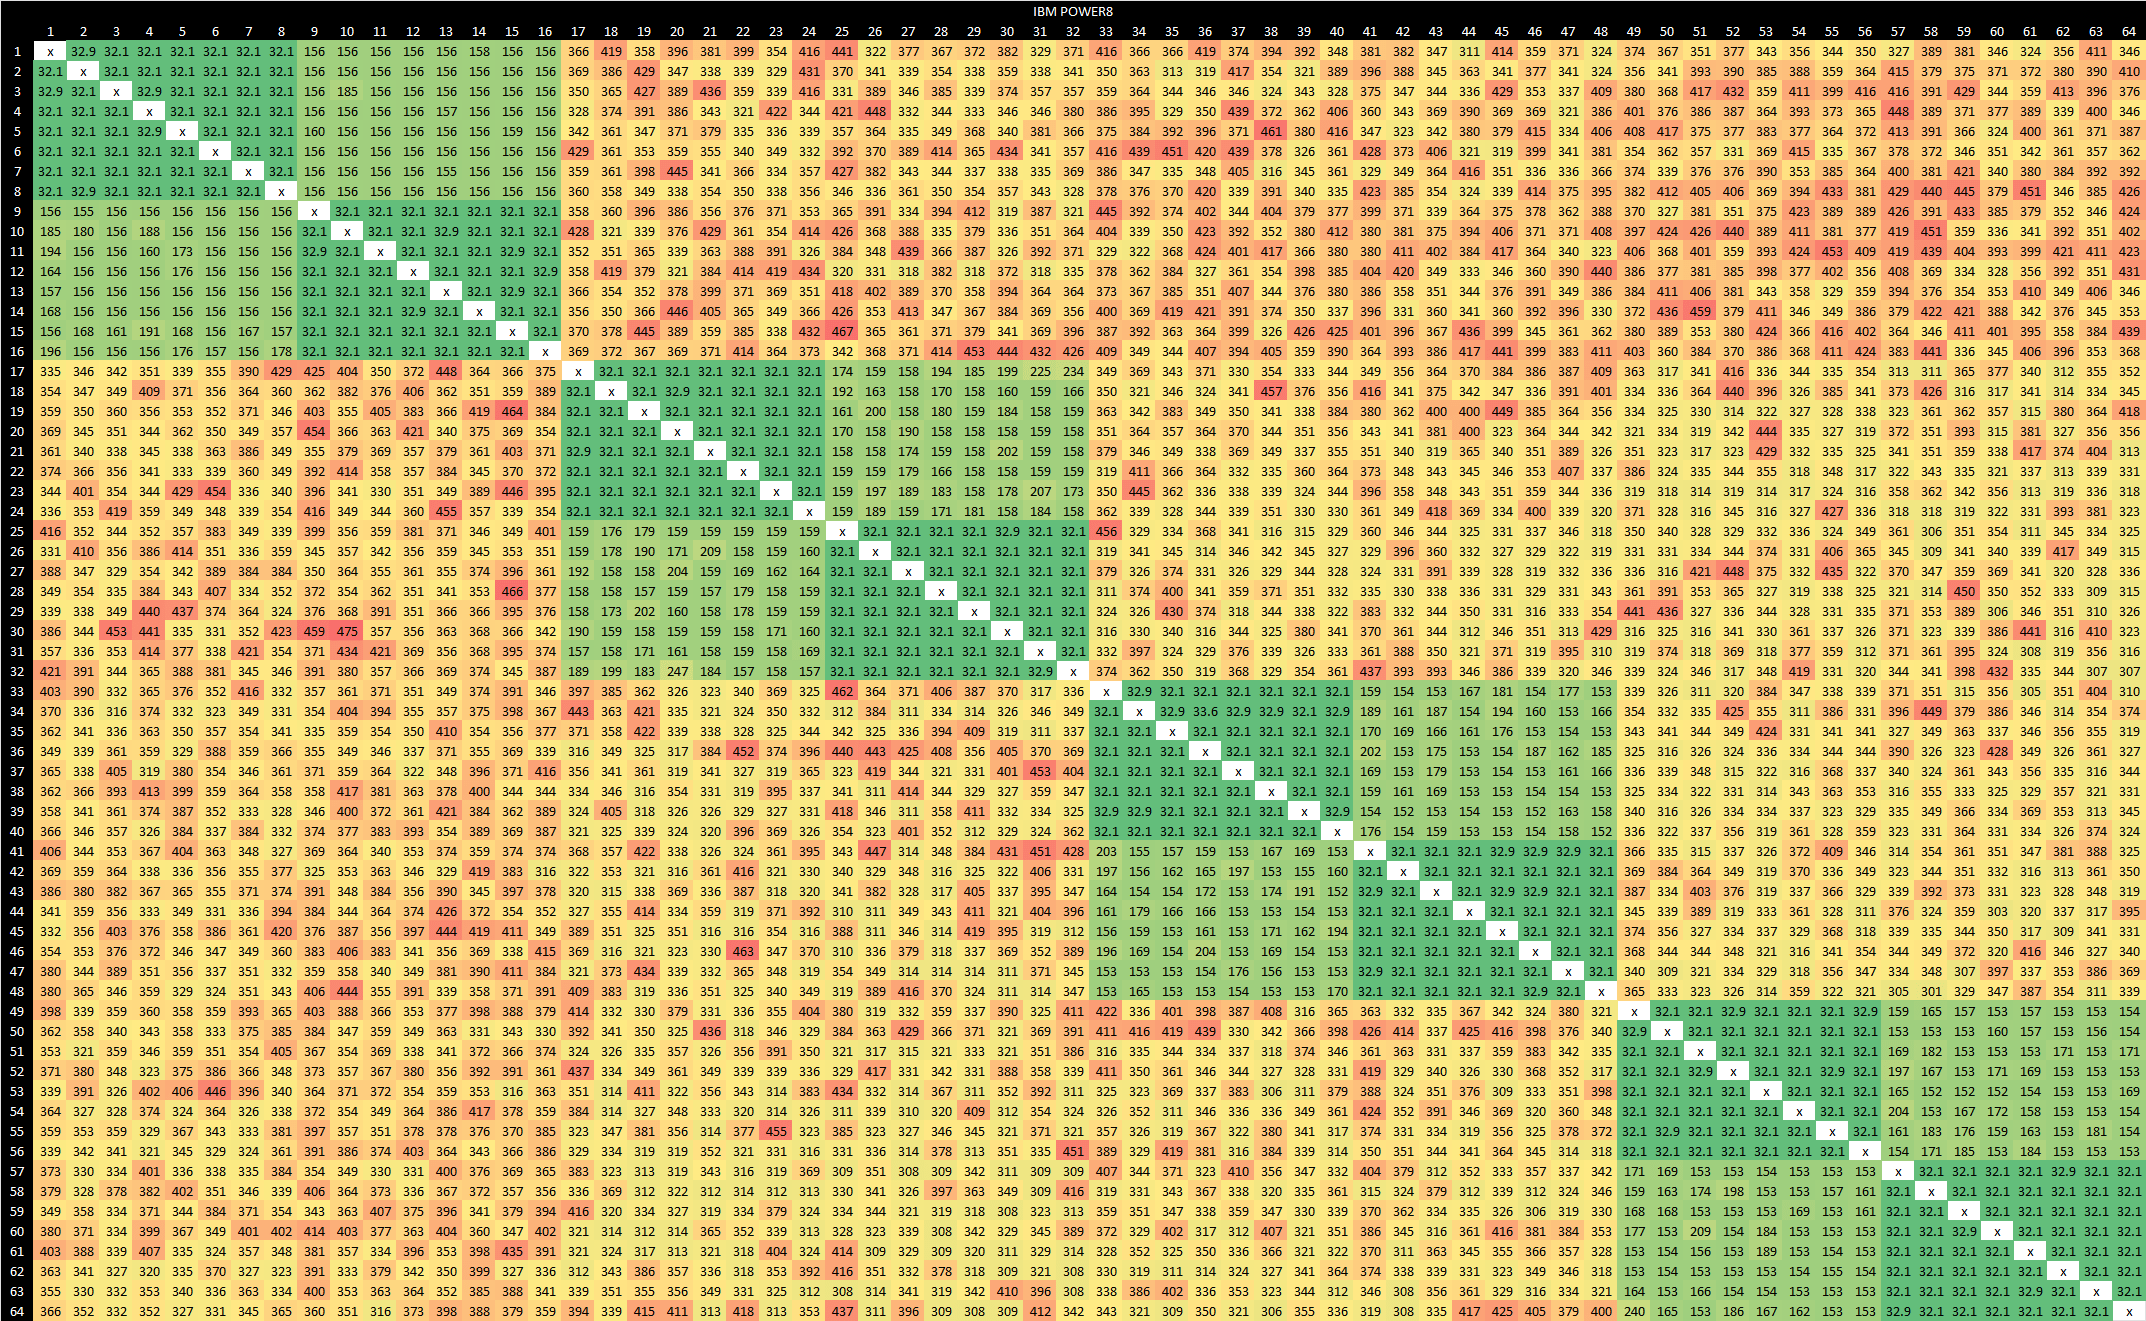
On a 8c/64t cloud VM, we see fast cross-thread communication within a core’s SMT siblings. After that, cores appear to be arranged in pairs. Within a pair, latencies are a tad high but still acceptable at around 150-200 ns. Across pairs, we’re pretty much looking at cross-socket latency at 300-400 ns.
Strangely, things look a lot better with a quad core VM. We’re no longer seeing pairs, and everything stays under 200 ns.
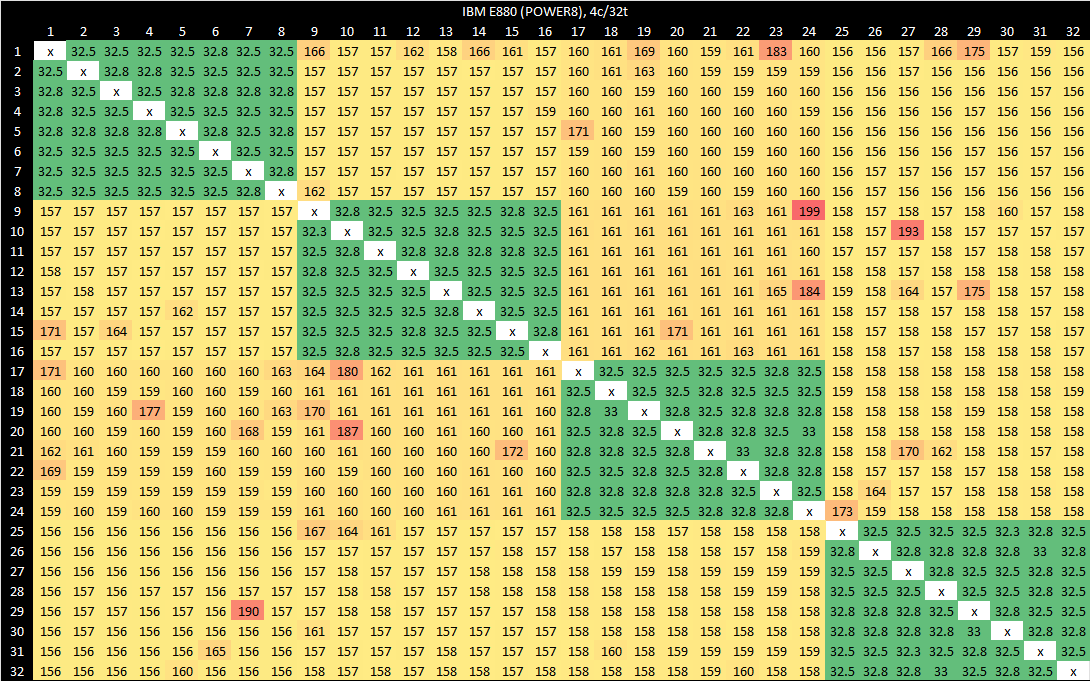
IBM may be crossing node boundaries for higher core counts, even if the requested core count would fit within a 12 core chip. If that’s the case, 300-400 ns for cross-node accesses is perfectly reasonable considering the scale-out potential.
IBM’s POWER9
POWER9 is obviously POWER8’s successor, with both higher core count and improved cores. Each POWER9 core has 8-way SMT, though you can also see it as two 4-way SMT cores sharing a 10 MB L2 region. It all depends on whether you’re coping with a garbage per-core licensing scheme.

As with POWER8, SMT siblings enjoy very fast cross-thread communication. The 8c/64t (or 4c/64t) instance being tested appears to have cores arranged in pairs as well. Latency is quite high within a core pair, at anywhere from 500 to 800 ns. Between pairs, latency is absolutely staggering and enters the microsecond range. I don’t know what the underlying system looks like, but I suspect these are cross-node accesses.
Sun’s UltraSPARC T1
Sun Microsystems’s T1, also known as Niagra, features eight cores on a crossbar. Each core features four-way SMT. The chip was originally meant for web workloads, and avoids out-of-order execution in favor of using a lot of SMT threads to hide L2 or memory latency.
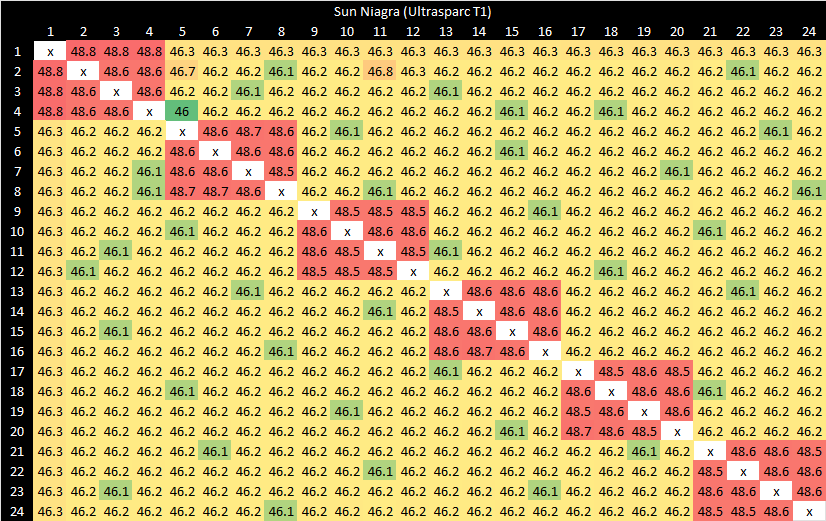
Cacheline bounce latency is generally very consistent at around 46 ns. Strangely, bouncing values between SMT siblings takes slightly longer than going between cores.
Cavium’s ThunderX CN8890
Cavium was an early player in the high core count ARM chip market. Their ThunderX CN8890 implements 48 cores per socket, and supports cross-socket coherency.
Bouncing cachelines between sockets is somewhat expensive, with an average of 315 ns. Intra-socket bounce latency is acceptable, with a 64 ns average.

Latencies within a socket are quite consistent, but there is a strange pattern. I’m not quite sure what to make of it.
Ampere eMAG 8180
Ampere today is better known for their Altra line, which has given the company a foothold in the cloud market. Before that, the company took a shot at the workstation market with eMAG. The eMAG 8180 features 32 cores and arranges them in pairs.

Cores within the same pair enjoy excellent latency for cache coherency operations. Across the rest of the rest of the chips, latencies are in line with what you’d expect from the average mesh.
Intel’s Knights Landing (Xeon Phi)
Knights Landing implements up to 72 teeny tiny Silvermont-derived cores with gigantic 2×512-bit FMA units on a big mesh. The Xeon Phi 7210 has 64 cores enabled. Each core has 4-way SMT, making for huge core to core latency result images.

We can also configure the system in SNC4 (sub-numa clustering) mode, which splits the die into four quadrants.
Intel’s Pentium
Yes, we’re talking about the original Pentium here. Long long ago, in a land far far away, you put two single-core CPUs together in a system and that was considered pretty powerful.

Pentium’s dual socket interconnect is nothing fancy. The two CPUs simply share a front side bus (FSB), which is also connected to a 430 NX chipset. CPUs arbitrate for FSB access and coherency is ensured by having each CPU observe transactions made by its peers. Over 500 ns looks bad compared to modern CPUs. But these things are running at 120 MHz, so 507.9 ns is really just 61 cycles. If Pentium could run at 3 GHz and the FSB got a proportional clock speed increase, core to core latency would be just over 20 ns.
Final Words
Increasing core counts have given us situational performance scaling as single threaded gains slow down. But building a multicore system involves a lot more than copy/pasting cores everywhere. Cores need a coherent view of memory, and threads need to synchronize with each other. The hardware that enables this becomes increasingly complex with higher core counts.
Core to core latency test results reflect that complexity. High core count systems often handle coherency at multiple levels, with a set of agents at each level covering parts of the physical address space. Latency varies depending on how far requests have to travel to the responsible agent. Worst case latency tends to increase as core count goes up, and variation does as well.
In the future, we can expect to see more variation with this test. CPU manufacturers will use different methods to handle coherency across tons of cores, making life more interesting for everyone.
If you like our articles and journalism, and you want to support us in our endeavors, then consider heading over to our Patreon or our PayPal if you want to toss a few bucks our way. If you would like to talk with the Chips and Cheese staff and the people behind the scenes, then consider joining our Discord.
Do you have any Apple M-Max or M-Ultra core to core latency data?