
CPU-Z’s Inadequate Benchmark

CPU-Z is a hardware information tool from a company called CPUID, not to be confused with the CPUID instruction. Besides showing basic CPU, motherboard, and memory information, CPU-Z features a built-in benchmark. While the benchmark isn’t its primary function, it has made its way into some reviews, as well as AMD’s slides. Its free, accessible nature means it naturally enters online discussions. Therefore, it’s worth investigating and understanding the CPU-Z benchmark.
I’ll be shoving CPU-Z’s benchmark through Intel’s Software Development Emulator to get an idea of what instructions it executes. Then, I’ll run the benchmark on several CPUs and use performance counters to evaluate how it challenges various CPU architectures. Since the benchmark doesn’t require AVX2, I’ll be running it on AMD’s older FX-8150 and Intel’s low-end Celeron J4125, in addition to Core i7-7700K, Ryzen 3950X, and Ryzen 7950X3D. Most of the focus will be on the single-threaded benchmark, because the multi-threaded benchmark appears to simply run the same workload on each logical core without stressing any system-level resources.
Instruction Mix
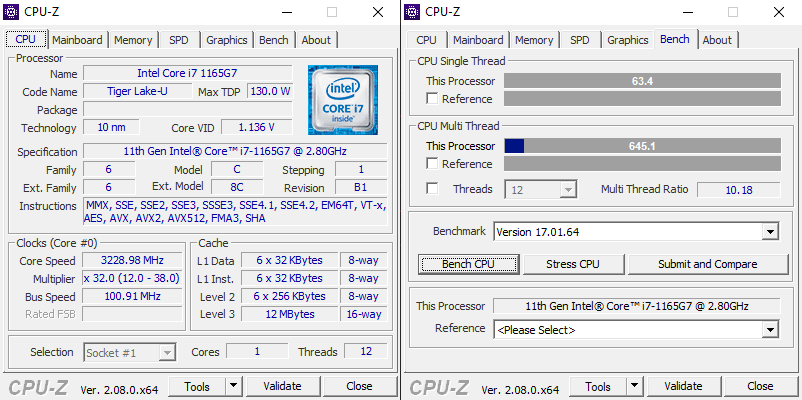
CPU-Z’s benchmark is a FP32 math test using SSE instructions. It does not leverage SSE’s vector math capability with the exception of some 128-bit memory accesses. Most SSE instructions are scalar FP32 adds, multiplies, conversions, or compares.

The average instruction length is 4.85 bytes, thanks to SSE instructions and memory operands with large displacements.

The long average instruction length could mean frontend throughput gets restricted by 16 byte per cycle L1 instruction cache bandwidth on older Intel CPUs. However, that limitation can be mitigated by op caches, and is only an issue if the execution engine can reach high enough IPC for frontend throughput to matter.
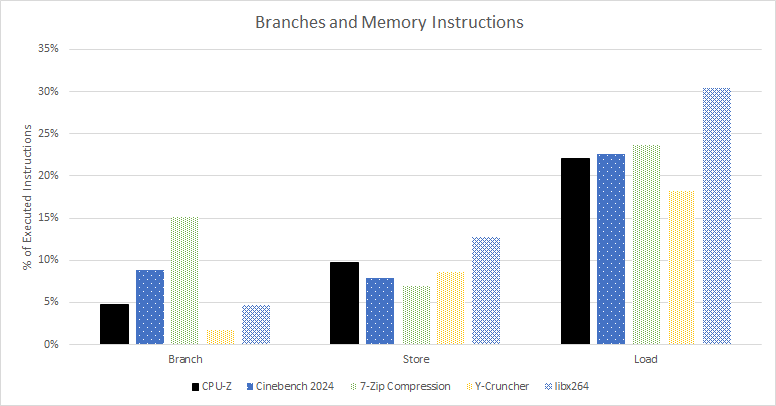
CPU-Z benchmark has a typical mix of memory accesses. Branches are less common in CPU-Z than in games, compression, and Cinebench 2024.
Performance Overview
CPU-Z is a moderate IPC benchmark. All of the CPUs here achieve a bit under half their core width. Bulldozer is an exception and struggles.

AMD’s Zen 4 and Intel’s recent CPUs can account for lost throughput in terms of pipeline slots. I’m using the methodology described in AMD’s PPR for Zen 4 and using VTune’s output for Kaby Lake. For Goldmont Plus, I’m using the ISSUE_SLOTS_NOT_CONSUMED and UOPS_NOT_DELIVERED events. Intel and AMD define Bad Speculation differently: AMD counts non-retired instructions fetched from the frontend; Intel starts counting at the subsequent renamer stage. Bad speculation rate would appear higher for Zen 4.

Goldmont Plus is a bit different because it can’t recover quickly from mispredicts. Like AMD’s Athlon, it has to wait for a mispredicted branch to retire, before it can figure out the known-good state and continue. Cycles spent waiting for that are labelled “recovery.”
All three CPUs show similar high-level behavior. Core throughput is good, with the backend facing the biggest challenge. The frontend keeps the core well-fed without major problems, but there’s a bit of room for improvement.
Backend
The backend gets all the fun, so let’s start there. Most of the time, the backend can’t clear out an operation because it’s waiting for a computation to complete. It’s the opposite of what we saw in games and Cinebench 2024, both of which are overwhelmingly memory bound.

A quick peek at cache hitrates shows us why. CPU-Z’s benchmark works on very little data. It fits within the 32 KB L1 data cache on both CPUs above.
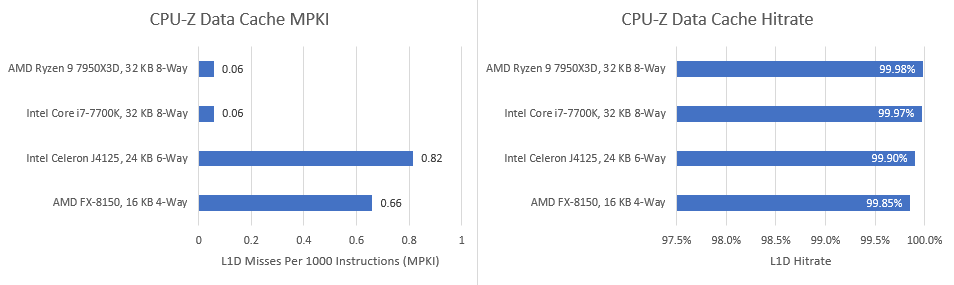
Even Bulldozer’s teeny tiny 16 KB L1D enjoys 99.9% hitrate and experiences less than one miss per thousand instructions. Call of Duty Cold War misses a 96 MB cache more often than CPU-Z misses in a 16 KB one. CPU-Z’s multithreaded mode doesn’t change the picture either, because the working set for two threads is still small enough to allow over 99% hitrates. For example, Kaby Lake sees L1D hitrate drop from 99.97% to 99.78% for a whopping 0.2% difference between the single threaded and multithreaded portions of CPU-Z’s benchmark. If that’s not margin of error, I don’t know what is.
I’m going to stop with the data side memory footprint analysis because the L2 cache, L3 cache, and DRAM setup don’t come into the picture. The “memory bound” cycles are just loads held up on data cache latency, which the out-of-order engine should easily absorb.
Out of Order Execution
Normally, an out-of-order engine’s biggest challenge is access to slower cache levels and memory. L3 access can take 40-50 cycles, while DRAM access can take hundreds. With CPU-Z, we’re largely facing down FP execution latency, which typically ranges from 3 to 5 cycles. CPUs have to move past in-progress or stalled FP instructions to find independent instructions.
Starting with the oldest CPU in the mix, Bulldozer brings a gigantic 60-entry FP scheduler meant to serve two threads. With the sibling thread idle, the shared FPU provides an overkill FP scheduling capacity for the active thread. Stalls on a full FP scheduler still occasionally happen, suggesting CPU-Z has very long FP dependency chains. However, there’s plenty of independent instructions among the dependent ones. Completed independent instructions can leave the scheduler, but have to be tracked in the reorder buffer until their results can be made final (retired).
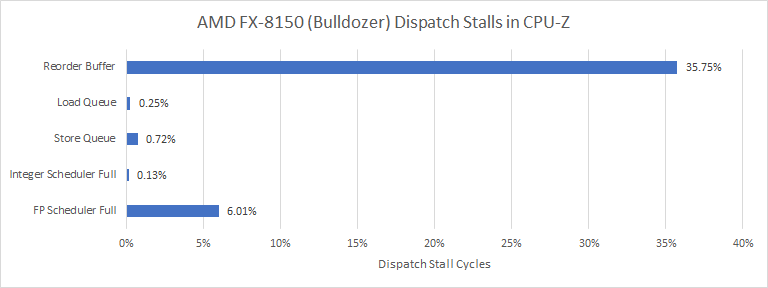
Bulldozer has an 128-entry reorder buffer for each thread, which fills often and limits how far the core can look ahead to extract parallelism. FP port utilization on Bulldozer is low even though CPU-Z consists primarily of FP instructions. Bulldozer’s FP scheduler had something in it over 90% of the time, so FP operations look latency bound.

Kaby Lake is a Skylake derivative, making it a good representation for five generations of Intel CPUs. It’s an especially good representation for this benchmark since L3 cache and memory controller improvements don’t matter. A large 58-entry scheduler handles both scalar integer and FP operations. As in Cinebench 2024, that’s a liability because the core can’t bring as much total scheduling capacity to bear.
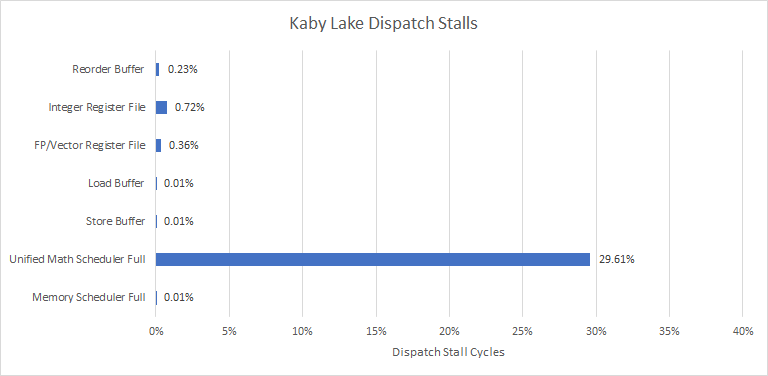
However, Kaby Lake can keep more independent operations in flight with its 224-entry reorder buffer. Basic FP operations on Kaby Lake generally have a 4-cycle latency compared to 5 cycles on Bulldozer, so Kaby Lake can get through those FP dependency chains faster too.
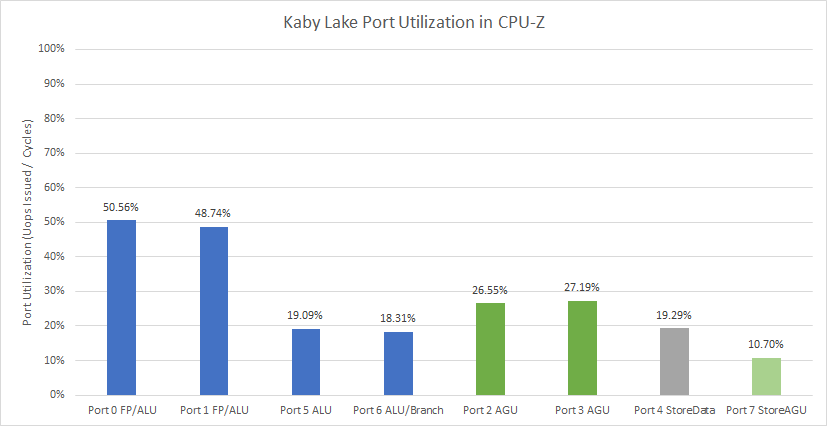
Kaby Lake’s port utilization is in a good place, with heavy but not overwhelming load on the two FP pipes. Execution latency is more of an issue than port count, even though Kaby Lake has fewer FP ports compared to contemporary AMD CPUs.
AMD’s Zen 2 architecture competed with Skylake derivatives. It features an even better 3-cycle latency for FP adds and multiplies. The FPU has a 36-entry scheduler and a 64-entry non-scheduling queue in case the scheduler fills up. That lets it track 100 incomplete FP operations before causing a stall at the renamer, moving the bottleneck to the 224-entry ROB.
FP port utilization is in a good place for Zen 2. The FP add pipes see slightly higher load, likely because the FP2 pipe is shared with FP stores.

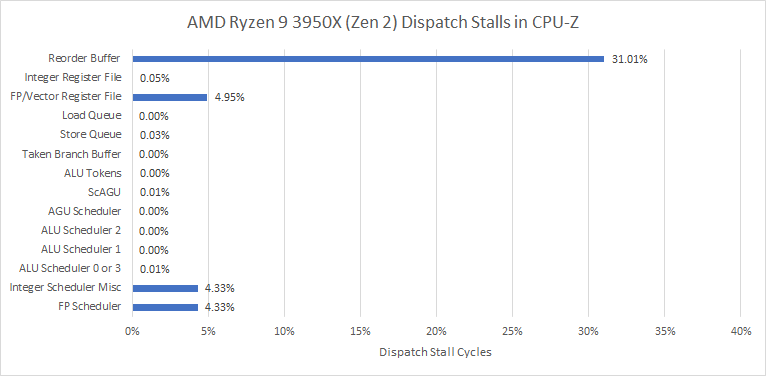
Zen 4 is AMD’s current generation architecture. It can keep nearly 128 incomplete FP operations in flight thanks to an improved 2×32 FP scheduler layout and a 64-entry non-scheduling queue in front of it. We still see some FP scheduler stalls however. That counter only increments when the non-scheduling queue fills as well, so CPU-Z’s FP dependency chains are very long.

Instead of the ROB filling as on Zen 2 and Bulldozer, Zen 4 runs out of FP register file capacity. That suggests a lot of the independent instructions found among dependent ones are floating point operations. Zen 4 has a 192-entry FP register file. It’s larger than the 160-entry one in Zen 2 and Zen 3, but from AMD’s slides, evidently that didn’t help much.

Like the other CPUs, Zen 4 isn’t bound by ports. Utilization is lower than in Zen 2, thanks to the dedicated FStore pipes taking load off the FP add pipes. Zen 2 put floating point and vector stores on one of the FP add pipes, resulting in higher utilization.
From this data, I suspect FP execution latency matters most for CPU-Z. Then, the out-of-order execution engine needs enough scheduler capacity to get past long dependency chains and search for instruction-level parallelism. Finally, the core needs a big reorder buffer and register files to hold results for all those in-flight instructions.
Frontend
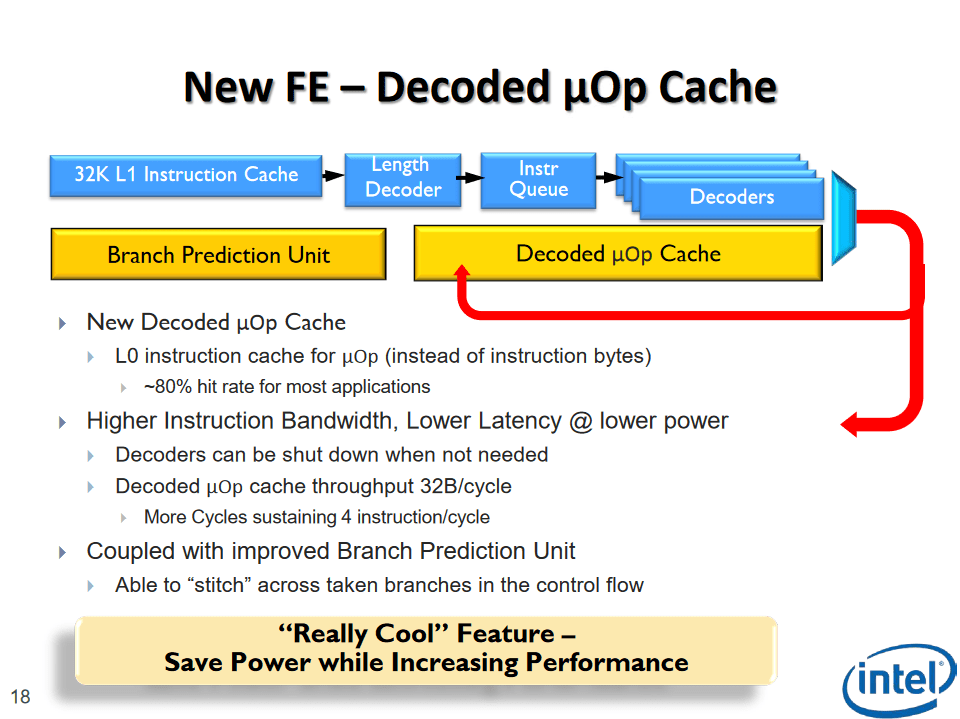
A CPU’s frontend is responsible for bringing instructions into the core. It’s not seriously challenged by CPU-Z’s benchmark, but it’s nice to understand why. In short, the instruction footprint is tiny. Recent CPUs have an op cache that holds decoded instructions in a CPU’s internal format (micro-ops). However, op caches have to be small because micro-ops are typically larger than x86 instructions. CPUs still have formidable decoders because op caches are designed for speed rather than caching capacity. Engineers therefore expect code to spill out of the op cache very often. But CPU-Z doesn’t.

Kaby Lake, Zen 2, and Zen 4 have micro-op caches. All three deliver more than 90% of micro-ops from the op caches, so the decoders rarely come into play. This is great for Kaby Lake, which would otherwise have to feed a four-wide decoder with 16 bytes per cycle of instruction cache bandwidth. Recall that average instruction length is 4.85 bytes, so Kaby Lake’s instruction cache only has enough bandwidth to sustain 3.3 IPC. Zen 4’s larger op cache is overkill because Zen 2’s 4096-entry one is already large enough to contain the entire benchmark.
The multithreaded portion of CPU-Z’s benchmark could provide more of a challenge, because it’ll make a core’s two SMT threads fight for micro-op cache capacity. Intel comes off the worst here because it statically partitions the micro-op cache. With 768 entries available per thread, micro-op cache coverage drops to 84.16%. That’s still higher than what Intel expected for typical applications when Sandy Bridge launched 12 years ago. And I’m pretty sure Intel evaluated the ideal case where the other SMT thread is either idle, or SMT is off completely.
AMD uses physical addresses to access the op cache, so entries can be shared across multiple threads running the same code. As a result, Zen 2 and Zen 4 barely take any hitrate reduction when CPU-Z’s benchmark switches to multithreaded mode.
For CPUs that don’t have an op cache, the L1 instruction cache contains CPU-Z’s code. everyone gets around 99.9% hitrate.

With nearly zero instruction cache misses, CPU-Z doesn’t challenge the frontend on any CPU. Thus, the challenge moves from feeding the core with instructions to executing those instructions. Running two threads in the core barely changes things. For example, Bulldozer’s L1i hitrate drops from 99.88% to 99.65% when two threads are running in a module, for less than 1% of difference.
Branch Prediction
A branch predictor’s job is to follow the instruction stream. Compared to Cinebench and gaming workloads, CPU-Z has fewer branches, which are also easier to predict. Bulldozer has a harder time, but mispredicts are a minor problem even on that old core. Even Zen 4 suffers more mispredicts per instruction in games.

Intel and AMD’s more modern cores have similar branch prediction accuracy. AMD has invested a lot of die area into more advanced branch predictors, but gains little in the CPU-Z benchmark. That suggests most branches are easily predictable, but a small minority either require very long history or aren’t seen often enough for the predictor to train on them. Sharing the branch predictor between two threads with CPU-Z’s multithreaded benchmark mode slightly reduces branch predictor accuracy, but it’s still nowhere near as challenging as Cinebench 2024 or games.
Branch Footprint
The whole point of branch predictors is to make branches go fast. Part of this involves remembering where commonly seen branches go, using a cache of branch targets called a branch target buffer (BTB). Getting the branch destination from the BTB lets the predictor tell the frontend where to go without having to see the branch and calculate the destination from there.
CPU-Z has fewer unique branches than Cinebench 2024 or games. Even Goldmont Plus has no problem tracking CPU-Z’s branches, even though its BTB is the smallest of the bunch.

High performance CPUs have 4096 or more BTB entries to deal with larger branch footprints, but CPU-Z doesn’t need that. Even Zen 4’s 1.5K-entry L1 BTB is large enough.
Final Words
Benchmarking is tough. No benchmark can represent the broad range of applications that users will run. For example, Cinebench can’t exactly mirror a gaming workload. However, the primary challenges facing modern workloads are branch prediction and memory accesses, and a lot of benchmarks do present these challenges.
What limits computer performance today is predictability, and the two big ones are instruction/branch predictability, and data locality.
Jim Keller, during an Interview with Dr. Ian Cutress
That’s not just Jim Keller’s opinion. I’ve watched CPU performance counters across my day-to-day workloads. Across code compilation, image editing, video encoding, and gaming, I can’t think of anything that fits within the L1 cache and barely challenges the branch predictor. CPU-Z’s benchmark is an exception. The factors that limit performance in CPU-Z are very different from those in typical real-life workloads.

From AMD’s slides, Zen 4 barely improves over Zen 3 for CPU-Z. AMD’s architects likely saw changes that could benefit CPU-Z wouldn’t pay off in other applications. Zen 4 received improvements like a larger micro-op cache, better branch prediction, and doubled L2 cache capacity. Those would help a lot of applications, but not CPU-Z. Thus, CPU-Z’s benchmark ends up being useless to both CPU designers and end users.

I hope CPUID revises its benchmark to bring it more in line with common workloads. They should run typical desktop applications and monitor performance counters to see what typical branch and memory footprints look like. These types of data should be used to inform benchmark design for future CPU-Z versions.
If you like our articles and journalism, and you want to support us in our endeavors, then consider heading over to our Patreon or our PayPal if you want to toss a few bucks our way. If you would like to talk with the Chips and Cheese staff and the people behind the scenes, then consider joining our Discord.
Illuminating article.