A New Year and New Tests: GPU L1 Cache Bandwidth
In my past articles on GPUs, I didn’t have good measurements for L1 cache bandwidth. Microbenchmarking cache bandwidth is harder on GPUs than CPUs. That’s because programming GPUs in assembly code is impractical. GPU instruction sets change between manufacturers and even between GPU generations from the same company. Writing and validating a different test for every GPU is utterly unreasonable for a free time project like this site. Therefore, I’m writing tests in OpenCL, which lets me run the same code on everything from AMD’s pre-2010 Terascale GPUs and nVidia’s pre-2010 Tesla GPUs to the newest stuff on the market today.
Because OpenCL kernels are compiled, I have to prevent the compiler from optimizing out what I’m trying to test. That means accessing enough memory locations to keep the compiler from storing data in registers, and performing computations on the loaded data so the compiler can’t eliminate the memory accesses. In turn, that means the generated code will have a few extra math and address generation instructions. While CPUs have enough core width for that to not matter, GPUs cores have limited instruction dispatch bandwidth. It’s easy to get test results limited by execution unit throughput rather than cache bandwidth.
Anyway, I finally got time to sit down and try writing tests. Instead of trying to make the test flexible to cover a different data footprints, I’m fixing the test size to 4 KB. That should fit comfortably within any GPU’s L1 cache. Since that is a power-of-2 size, I can use simple masking operations to make sure accesses don’t go out-of-bounds instead of more expensive comparisons and branches. Nvidia’s Kepler, Maxwell, and Pascal architectures don’t cache global loads in L1 by default, so I’m using a read-only texture (image1d_buffer_t), which does benefit from L1 caching in those architectures.
Besides global memory, which is backed by VRAM, GPUs have a local memory space (OpenCL term) that maps to small but high bandwidth on-chip memories. Unlike a true cache, software has to explicitly copy data into local memory. But once that’s done, they can benefit from consistently low latency and high bandwidth access to that data. Nvidia calls this Shared Memory and AMD calls it the Local Data Share. I also wrote code to test local memory bandwidth. It should provide equal or higher bandwidth than the L1 cache.
With some test code written, it’s time to validate it by running it on a few different GPUs. Getting 100% of theoretical bandwidth isn’t going to happen, but I can be fairly confident my test is working well if I get figures in the 80-90% of theoretical range.
AMD RDNA 2
My first stop is the RX 6900 XT because it’s my primary gaming GPU. It’s also a convenient test target because I can lock it to 1 GHz. With that done, I can get per-cycle bandwidth figures by dividing by 1. The RX 6900 XT implements AMD’s RDNA 2 architecture, which uses Workgroup Processors (WGPs) as its basic building block. Each WGP has four 32-wide SIMDs. Pairs of SIMDs share a 16 KB vector cache capable of delivering 128 bytes per cycle. All four SIMDs can share a 128 KB LDS, which can deliver 128 bytes per cycle to each pair of SIMDs. In total, the WGP has 256 bytes per cycle of vector cache bandwidth and 256 bytes per cycle of LDS bandwidth. Across the whole GPU, the RX 6900 XT has 40 WGPs.
AMD’s compiler generated buffer_load_format_xyzw instructions for the read_imageui OpenCL function. According to the RDNA 2 ISA manual, this instruction does an “untyped buffer load 4 dwords with format conversion”. A dword, or double word, is a 32-bit or four byte value. Four of them would be 16 bytes, and doing so across a 32-wide wave would mean 512 bytes get loaded by a single instruction.
So far so good. I’m getting very close to theoretical. If I let the 6900 XT run at stock clocks, I measure an incredible 23.4 TB/s of first level bandwidth.
For the local bandwidth test, the compiler emitted ds_read2_b32 instructions. ds_read2_b32 actually loads two 32-bit values even though I’m not using fancy vector types like uint2. I guess the unrolled loop was easy enough to optimize.
Well, we have a problem. Simply running the test results in lackluster efficiency. I’m getting more than 128 bytes per cycle, which is good news, but RDNA(2) should do much better. I think the problem is RDNA 2’s 128 KB LDS is actually built from two 64 KB arrays connected with a crossbar.
Perhaps the crossbar suffers contention under very high LDS traffic, which my test is designed to generate. On RDNA 2, kernels can be dispatched in either CU mode or WGP mode. RDNA 2’s ISA manual also provides some advice:
In CU mode, waves are allocated to two SIMD32’s which share a texture memory unit, and are allocated LDS space which is all local (on the same side) as the SIMDs. This mode can provide higher LDS memory bandwidth than WGP mode
In WGP mode, the waves are distributed over all 4 SIMD32’s and LDS space maybe allocated anywhere within the LDS memory. Waves may access data on the “near” or “far” side of LDS
equally, but performance may be lower in some cases.
Forcing CU mode by setting the environment variable GPU_ENABLE_WGP_MODE=0 brought the bandwidth up significantly.
AMD’s GCN
AMD’s FirePro W7000 uses the GCN-based Pitcairn chip. It’s the first generation of AMD’s venerable GCN architecture, which served on AMD GPUs for most of the 2010s. The Radeon R9 390 scales things up and uses an improved version of GCN. GCN’s basic building block, the Compute Unit, has four 16-wide SIMDs. All four SIMDs share a 16 KB L1 vector cache capable of delivering 64 bytes per cycle. They also share a 64 KB Local Data Share with 128 bytes per cycle of bandwidth. The FirePro W7000 has 20 CUs, while the R9 390 has 40.
On GCN I’m getting very close to theoretical bandwidth, which is excellent. As with RDNA 2, GCN uses buffer_load_format_xyzw instructions. RDNA and GCN may be very different architectures, but their instruction sets have a lot in common. Even the opcode for buffer_load_format_xyzw stayed the same.
For my local memory bandwidth test, the compiler generated ds_read2_b32 instructions for Hawaii and ds_read_b32 instructions for Pitcairn. Hawaii again does incredibly well. Pitcairn has a bad day. Perhaps Pitcairn is at a disadvantage because the compiler made it use scalar ds_read_b32 instructions, which only return a single 32-bit value. Hawaii and RDNA 2 before were loading twice as much data per LDS access instruction. So, I tried modifying the test to use 64-bit integer values, and sank the results with XOR operations. 64-bit integer adds on GPUs tend to result in two dependent 32-bit adds (add with carry), and I wanted to avoid getting stuck on execution latency. The compiler generated ds_read_b64 instructions, which should load the same amount of data as ds_read2_b32. Results are better but still not where I want them to be.
Looking further at generated assembly indicates I could be running into address generation overhead. Pitcairn is using v_mad_u32_u24 instructions to generate array addresses, and integer multiplication typically executes at 1:4 rate or worse. Nvidia’s Turing and subsequent architectures have better integer multiply performance, but that doesn’t help Pitcairn.
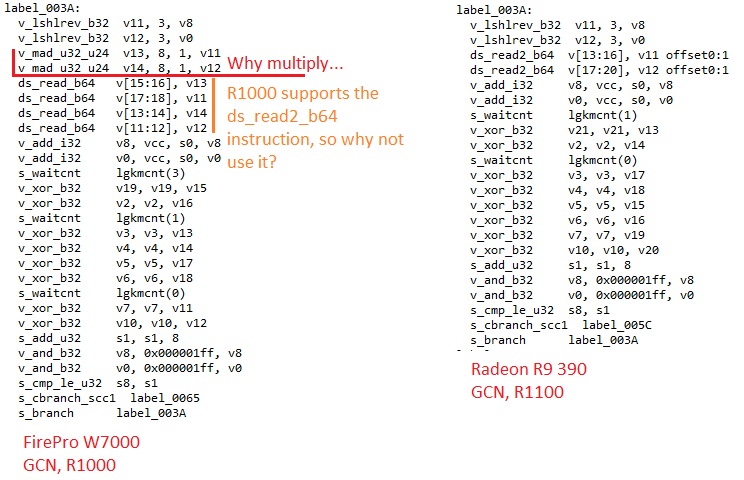
There is still work to be done on adjusting the test to improve performance on Pitcairn.
Nvidia Pascal
Pascal is one of the longest lived Nvidia graphics architectures. 10-series cards still occupy top 10 spots on Steam’s hardware survey seven years after the architecture’s debut. Pascal’s basic building block is the Streaming Multiprocessor, or SM. An SM has four 32-wide SM Sub-Partitions, or SMSPs. All four SMSPs share a 96 KB block of Shared Memory, which can deliver 128 bytes per cycle. The SM has two 24 KB L1 texture caches, each private to a pair of two SMSPs. I couldn’t find theoretical figures for Pascal’s texture cache throughput, but each texture cache is attached to four TMUs. A RGBA texel with FP32 components is 16 bytes, so four TMUs should be capable of providing 64 bytes per cycle.
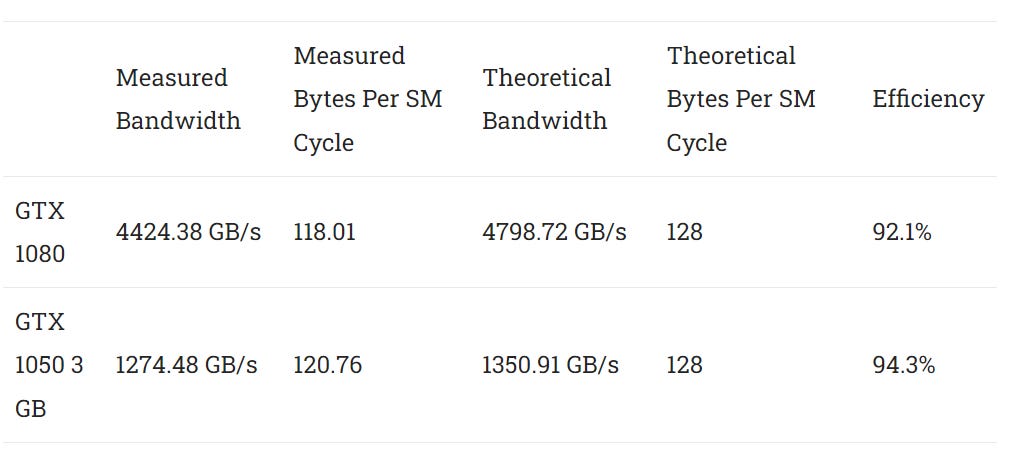
Nvidia’s GTX 1080 implements 20 SMs and clocks up to 1847.5 MHz. The smaller GTX 1050 3 GB has 6 SMs and can boost to 1759 MHz. During test runs, the GTX 1050’s clocks dropped to 1746.5 MHz, and the GTX 1080 dropped to 1822 MHz. That’s around a 1% difference so I’m going to ignore it.

read_imageui. Unfortunately, Nvidia’s assembly language (SASS) is not documented, so I’m doing some guessingNvidia’s compiler generated texture load instructions, which makes sense because I’m using an OpenCL image (texture) object. However, I’m not using texture filtering, normalized coordinates, or any other fancy TMU functionality. All the TMUs have to do is perform an array indexing calculation and return raw data from memory.
L1 bandwidth results are in line with expectations. Nothing to see here. The same applies to local memory.
The result again is excellent efficiency, despite using scalar 32-bit accesses from the perspective of a single thread. Using 64-bit data types did not make a significant difference.
I suspect Pascal is able to achieve near theoretical bandwidth despite using scalar local memory accesses because it can dual issue address generation instructions alongside load instructions.
Nvidia Ampere
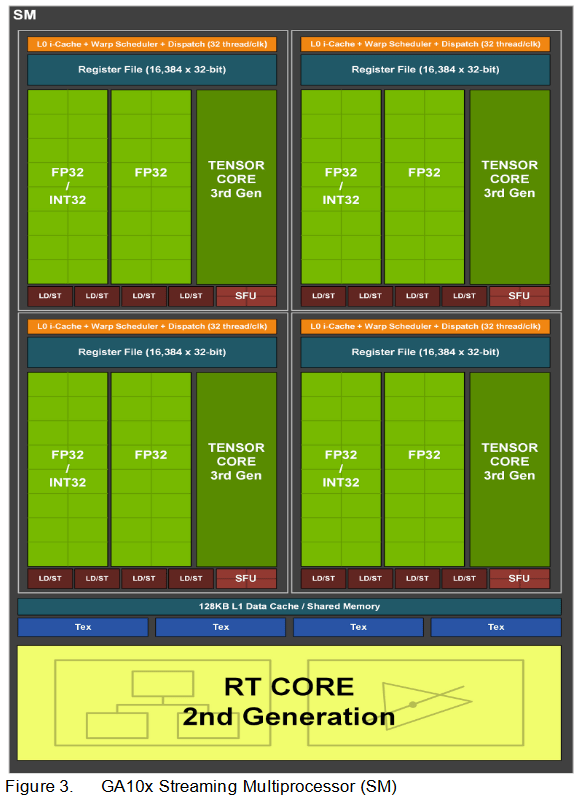
Ampere is a relatively modern Nvidia graphics architecture, and is contemporary to AMD’s RDNA 2. Like Pascal, an Ampere SM has four 32-wide SMSPs. However, all four SMSPs have 128 KB block of storage that backs both L1 cache and Shared Memory. According to the GA102 whitepaper, each SM can read 128 bytes per cycle from that block. I don’t have an Ampere GPU, so I rented a RTX A6000 instance from Lambda Cloud. The A6000 uses a GA102 chip with 84 enabled SMs, and runs at up to 1920 MHz. I also rented an A10 instance from Lambda Cloud, because why not. The A10 similarly uses the GA102 die, but only has 72 SMs enabled and boosts to 1695 MHz.
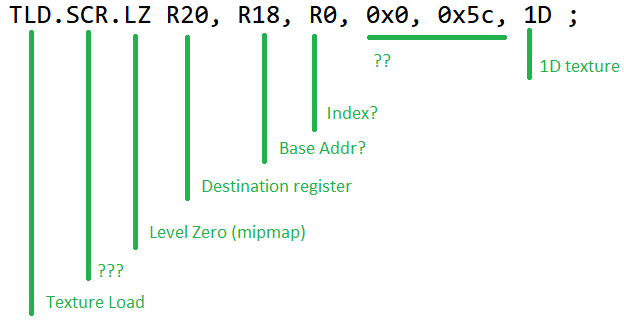
read_imageui. Again SASS is undocumented so I’m guessingLike Pascal, Nvidia’s compiler generated texture load instructions for Ampere.
Unfortunately test results are difficult to evaluate because Ampere suffers from more clock speed variations than the other GPUs tested so far.
My test actually involves running the kernel with increasing dispatch sizes, with the best result taken as the final one. Thus the start of the graph shows GPU behavior when only a few SMs are loaded. Both the RTX A6000 and A10 maintain their highest boost clocks under light load. But as dispatch sizes get big enough to fill the GPU, clocks start dropping. The A10 is clearly power limited as clocks reduce once power gets close enough to its 150W limit. The RTX A6000 is more difficult to understand. It reduces clocks even though the power draw isn’t approaching its 300W limit. Because the test gets its best results when the dispatch size is large enough to fill the shader array, it’s appropriate to evaluate the test using the lower clock speeds. With that in mind, the test achieves acceptable efficiency.
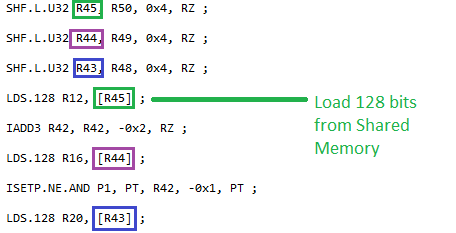
For the local bandwidth test, Nvidia’s compiler used LDS instructions much like with Pascal. SASS syntax in Ampere seems to omit the .32 qualifier. Likely, 32-bit access width is implied. Unlike Pascal though, Ampere cannot dual issue. Address generation and math instructions have to contend with Shared Memory loads for limited issue bandwidth. With regular 32-bit accesses, Ampere doesn’t get close to theoretical bandwidth. Don’t get me wrong, nearly 10 TB/s is a lot of bandwidth in absolute terms. But GA102 should be capable of a lot more.
To get around Ampere’s limited issue bandwidth, I rewrote the test to use float4 vectors hoping the compiler would be able to generate one address for four 32-bit loads per lane. The compiler gods smiled upon me, and that’s exactly what happened.
The float4 version achieves over 16 TB/s, but that’s still a bit further off than I’d like from the RTX A6000’s theoretical 20 TB/s of Shared Memory bandwidth. To cut to the chase, the RTX A6000 and A10 reduced clocks by 19.5% and 16.8% respectively. I have no good explanation for this behavior.
nvidia-smi output shows neither card was approaching power limits. That contrasts with the RX 6900 XT, which dropped clocks by around 13.4% as it approached its 300W limit. The RTX A6000 has a similar 300W power target, but was downclocking massively while drawing under 170W. Even stranger, both Ampere GPUs are happy to run at maximum clocks if the test is hitting just a few SMs. Ampere is somehow unable to sustain high boost clocks while pulling maximum bandwidth from Shared Memory when enough SMs are loaded, and it’s not power related.
Anyway, with clocks accounted for, my modified test gets close enough to theoretical. I also ran the float4 version on Pascal, and there was no significant difference.
Intel Gen 9
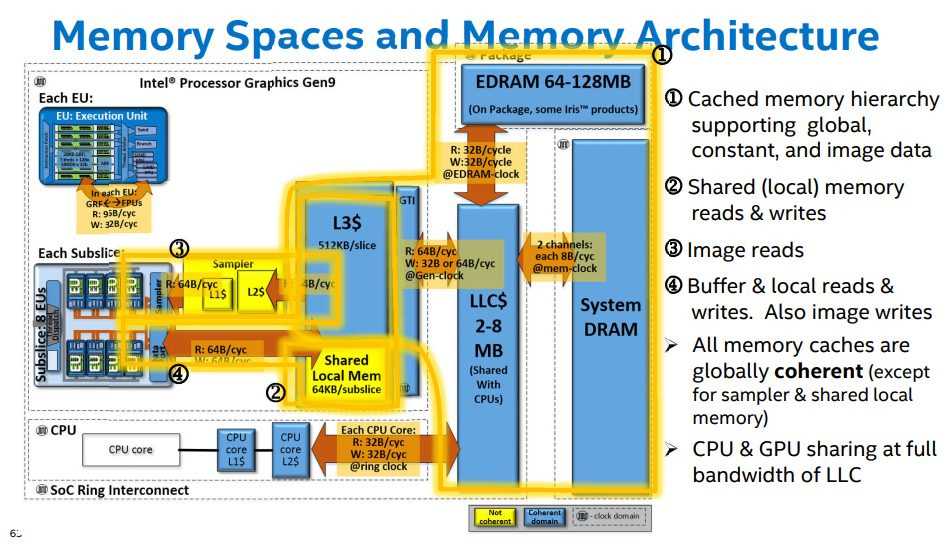
Intel’s Gen 9 graphics architecture served in Skylake’s integrated GPUs. Skylake was an exceptionally long lived architecture, filling out five generations of Intel CPUs. All of those used Gen 9 derivatives, so Gen 9 GPUs are incredibly numerous. Intel’s graphics architecture is very different from AMD and Nvidia’s architectures because it’s designed for small GPUs. Its basic building block is the Execution Unit (EU), which has eight FP32 lanes. But the next subdivision up, the Subslice, is where you find the first level of caches. A Subslice has two levels of sampler (texture) caches capable of delivering 64 bytes per cycle.
The Core i5-6600K’s HD 530 iGPU uses Gen 9’s most common GT2 configuration, which has three Subslices with eight EUs each. It runs at 1.15 GHz, and did not downclock during testing. The Celeron J4125’s UHD 600 uses a smaller two Subslice setup with six EUs each, and runs at 750 MHz.
From latency testing, image1d_buffer_t accesses appear to use the sampler caches. Intel’s assembly language is unusual too. EUs access memory by sending a message to the intra-subslice interconnect, which routes it to the specified recipient. In this case the recipient is the sampler unit (TMU).
Unfortunately I don’t get anywhere near 64 bytes per cycle. In fact, I’m so far off that I wonder if there’s a bottleneck somewhere that limits throughput to 32 bytes per cycle.
VTune shows the samplers are 100% busy and the EU array is stalled about 2/3 of the time, so address generation overhead isn’t a problem. Occupancy is 99.5%, so the GPU has about as much parallelism as it can track to hide latency.
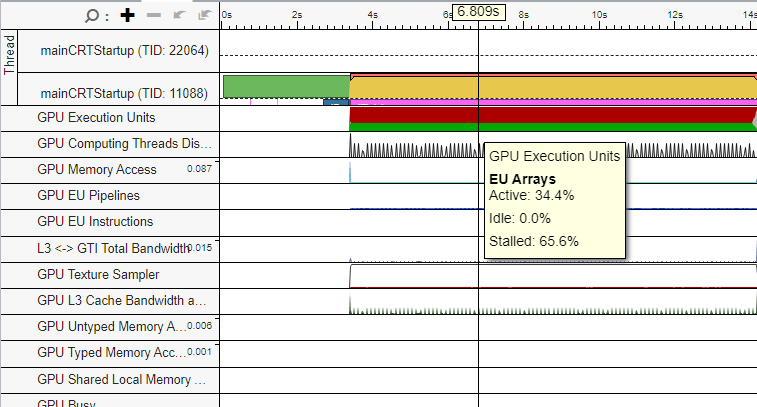
I’m not sure what’s going on, so let’s move to local memory. To keep the strangeness going, Gen 9 does not store local memory contents within the Subslice. Instead, local memory is stored in the iGPU’s L3 cache (not to be confused with the CPU’s last level cache). Specifically, each L3 bank has 128 KB of storage usable as cache and a separate 64 KB highly banked array used for local memory. Intel calls this Shared Local Memory, or SLM.

Shared Local Memory is also accessed by sending a message to the Subslice data port. Although GT2’s L3 has four banks and a theoretical 256 bytes per cycle of bandwidth, the three Subslices can only consume a total of 192 bytes per cycle. When SLM is used, each Subslice is associated with a L3 bank’s 64 KB highly banked portion. Because there are four L3 banks and only three Subslices, the 64 KB SLM array on the fourth bank is not used.
SLM bandwidth efficiency is much better at least on the HD 530. Besides servicing SLM and global memory requests, Gen 9’s L3 also has a portion of its data array allocated for the Uniform Return Buffer (URB). The URB is used to pass data between various blocks on the GPU. Each Subslice’s thread dispatcher has to read thread data from the URB before launching a thread on the EUs. That could cause contention with accesses from the shader array as threads finish at different times the thread dispatcher reads URB data to launch threads as scheduler slots are freed.
I’m not sure what’s going on with the UHD 600. I couldn’t find specifications Gemini Lake, but all other Gen 9 products can do 64 bytes per cycle per Subslice data port. Anyway, that’s a mystery for another time.
CPU and GPU Cache Bandwidth Compared
GPUs are also known as massively parallel bandwidth monsters designed to excel with simple, very parallel code. In contrast, CPUs focus on low latency and predictable performance across a wide variety of applications. L1 caches and local memory are the highest bandwidth blocks of storage accessible to programs after the register files, so GPUs should wreck CPUs. But how far apart are they?
The answer is “it depends”. High end consumer GPUs have 15-20 TB/s of load bandwidth, but multi-socket CPU setups can get surprisingly close. AMD and Nvidia’s high end RX 6900 XT and RTX A6000 get 24 and 17.6 TB/s respectively. But a quad socket Cascade Lake setup on IBM’s cloud gets 20 TB/s, while dual socket Milan-X on Azure gets 17 TB/s. GPUs are ahead in absolute terms, but those huge CPU configurations are in the same ballpark. Single socket high core count server CPUs have comparable first level cache bandwidth to Nvidia P100’s local memory.
Further down the graph, high end consumer CPUs like 16 core Ryzen parts and Intel’s Core i9-12900K bracket older GPUs like the GTX 1080. Dual socket Broadwell is a more contemporary comparison, and lands in the same neighborhood.
Finally, we have Intel’s Gen 9 GT2 configuration. The HD 530 somehow has less load bandwidth than the four CPU cores it shares the same die with, and not by a small margin. Each Skylake core can load 64 bytes per cycle from L1 cache and clocks much higher. A single Skylake core can achieve over 200 GB/s of load bandwidth, so the whole HD 530 GPU has about as much cache bandwidth as a single CPU core.
Final Words
Testing is hard. My idea for testing L1 cache and local memory bandwidth was pretty simple. However, I still hit some weirdness when validating the code. RDNA 2 needed CU mode, Ampere needed more explicit parallelism per-thread, and I have no clue what’s up with Intel’s Gen 9. I wound up with three variations of the local memory bandwidth test as I hit issues on different GPUs, which is frustrating because I like to keep things simple. In the end though, I’m happy with what I have so far. In most cases I’m getting close to theoretical bandwidth, which means I can take the test to GPUs where that’s unknown and make a good guess.
Measured bandwidth figures also tell a fun story about where GPUs stand in relation to CPUs. Today’s high end consumer GPUs have crazy amounts of load bandwidth. But older GPUs are nothing to sneeze at, either. Their shader arrays can pull several terabytes of data from caches. CPUs can also be bandwidth monsters, though you generally need a newer or larger CPU configuration to match a GPU.
Zooming out, caches are designed to tackle memory bottlenecks as compute power keeps outpacing developments in memory technology. Checking out L1 cache bandwidth shows how modern hardware keeps itself fed. Those small but fast L1 SRAMs can deliver terabytes and terabytes of data to minimize execution unit stalls. There’s an incredible amount of cache bandwidth on tap, even on GPUs from several years ago.
If you like our articles and journalism and you want to support us in our endeavors then consider heading over to our Patreon or our PayPal if you want to toss a few bucks our way or if you would like to talk with the Chips and Cheese staff and the people behind the scenes then consider joining our Discord.






mind sharing the repo for your benchmarks?