
Analyzing Starfield’s Performance on Nvidia’s 4090 and AMD’s 7900 XTX


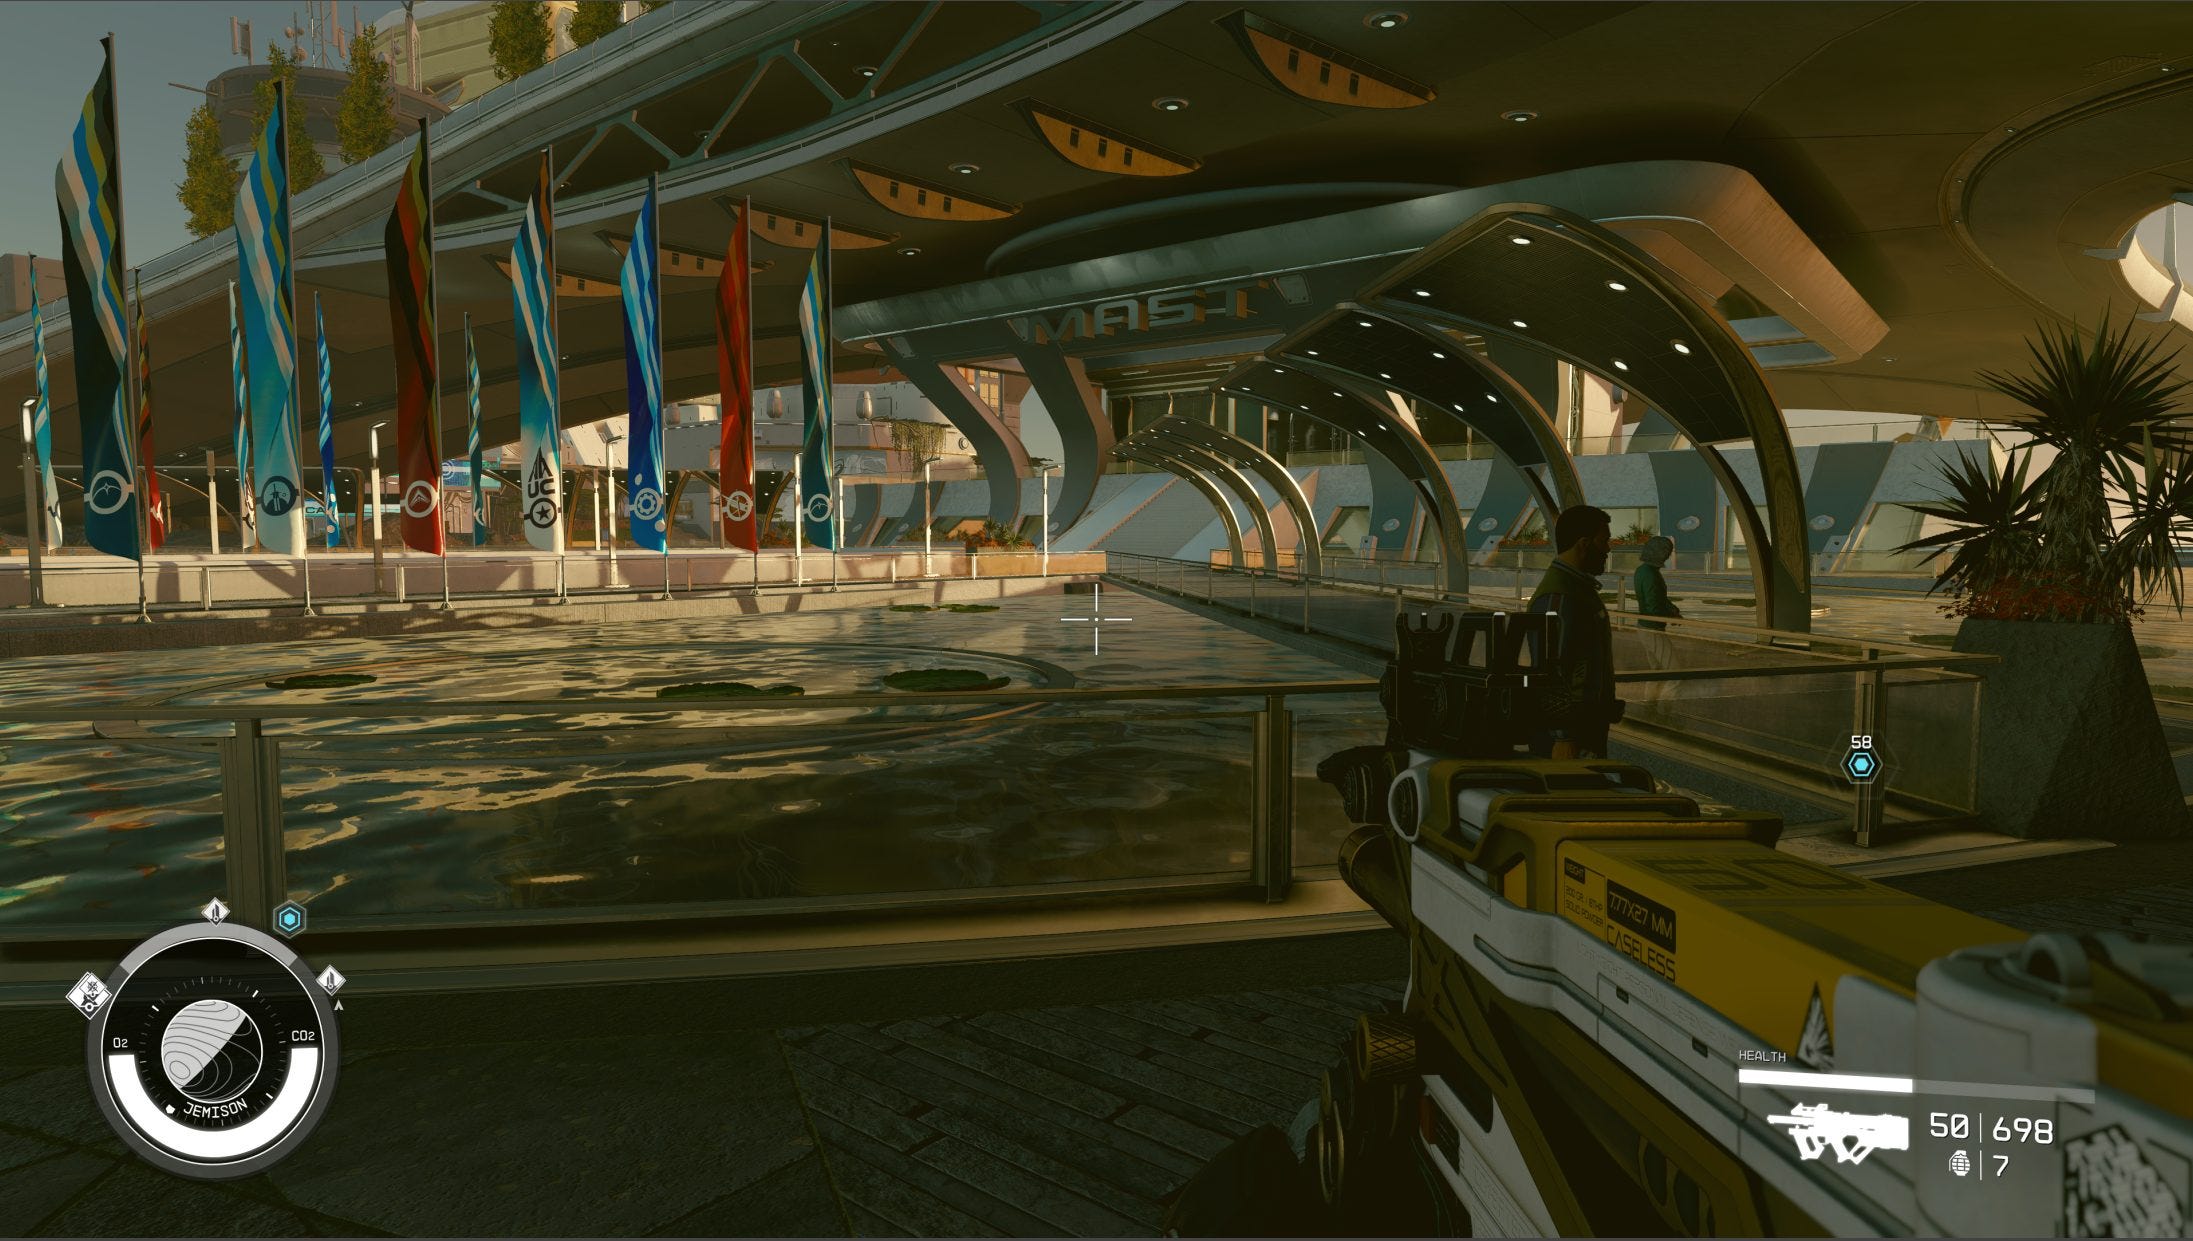
Bethesda has a history of making demanding AAA games set in immersive open worlds. Starfield is the latest, and can best be described as Skyrim in space. Open world games put heavy demands on developers and gaming hardware because the increased scope dramatically increases difficulty for everything involved. While Starfield gameplay appears relatively bug free, its graphics performance has attracted attention because AMD cards tend to punch above their weight. With that in mind, let’s examine a particular scene.
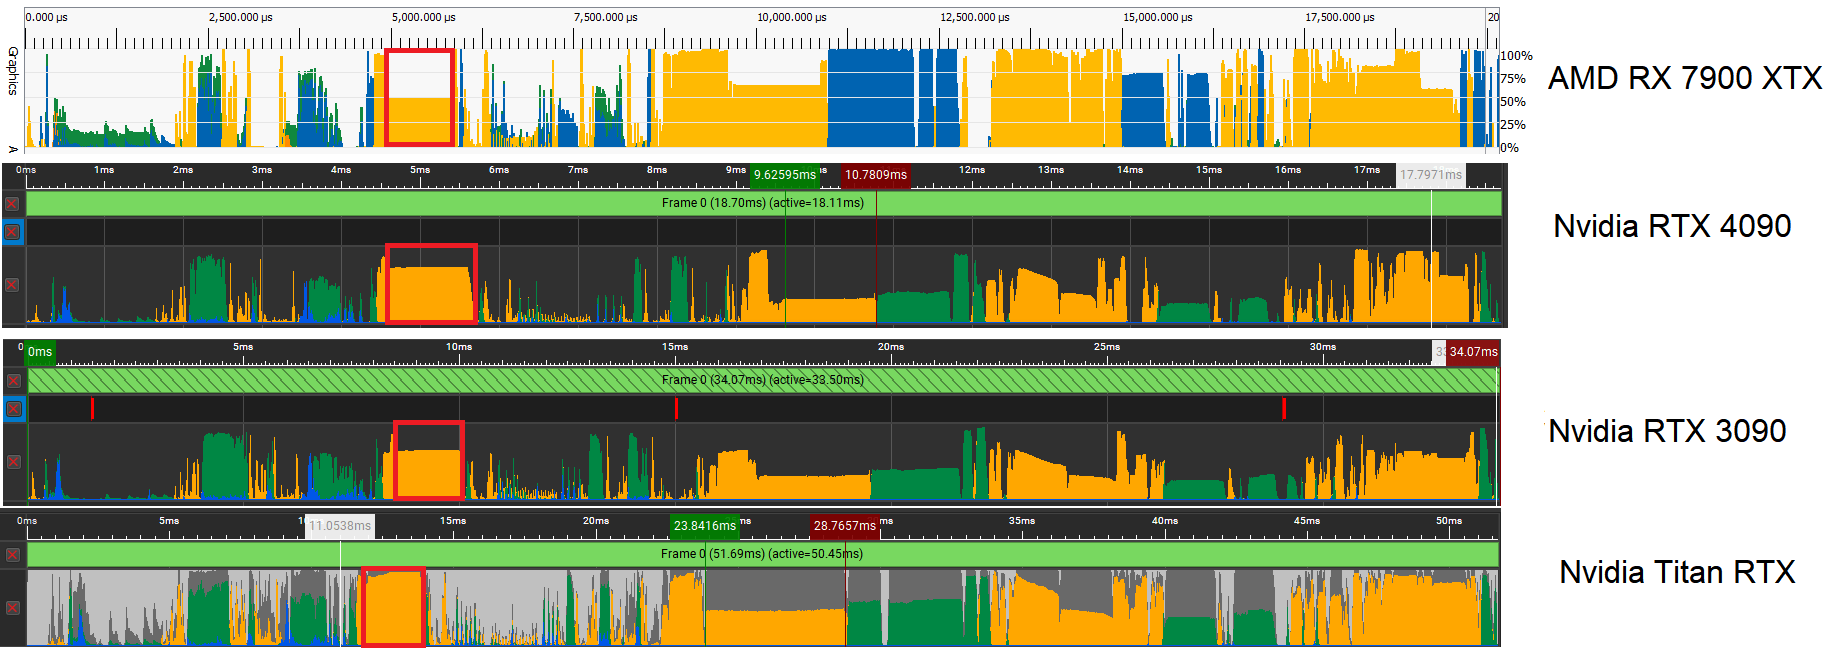
We analyzed this scene using Nvidia’s Nsight Graphics and AMD’s Radeon GPU Profiler to get some insight into why Starfield performs the way it does. On the Nvidia side, we covered the last three generations of cards by testing the RTX 4090, RTX 3090, and Titan RTX. On AMD, we tested the RX 7900 XTX. The i9-13900K was used to collect data for all of these GPUs.
Special thanks goes to Titanic for swapping GPUs and collecting data.
High Level
Starfield features a lot of compute. Pixel shaders still take a significant amount of time, because we ran the game at 4K to make it GPU bound. Vertex shaders and other geometry related stuff show up too, particularly near the start of the timeline.
If we line up the occupancy timelines from Radeon Graphics Profiler and Nvidia’s Nsight Graphics, we can see individual events line up across the GPUs. AMD and Nvidia swap colors for pixel and vertex shaders, but otherwise it’s pretty easy to correlate events.

We’ll be analyzing the three longest duration calls because digging through each of the ~6800 events would be impractical.
Longest Duration Compute Shader
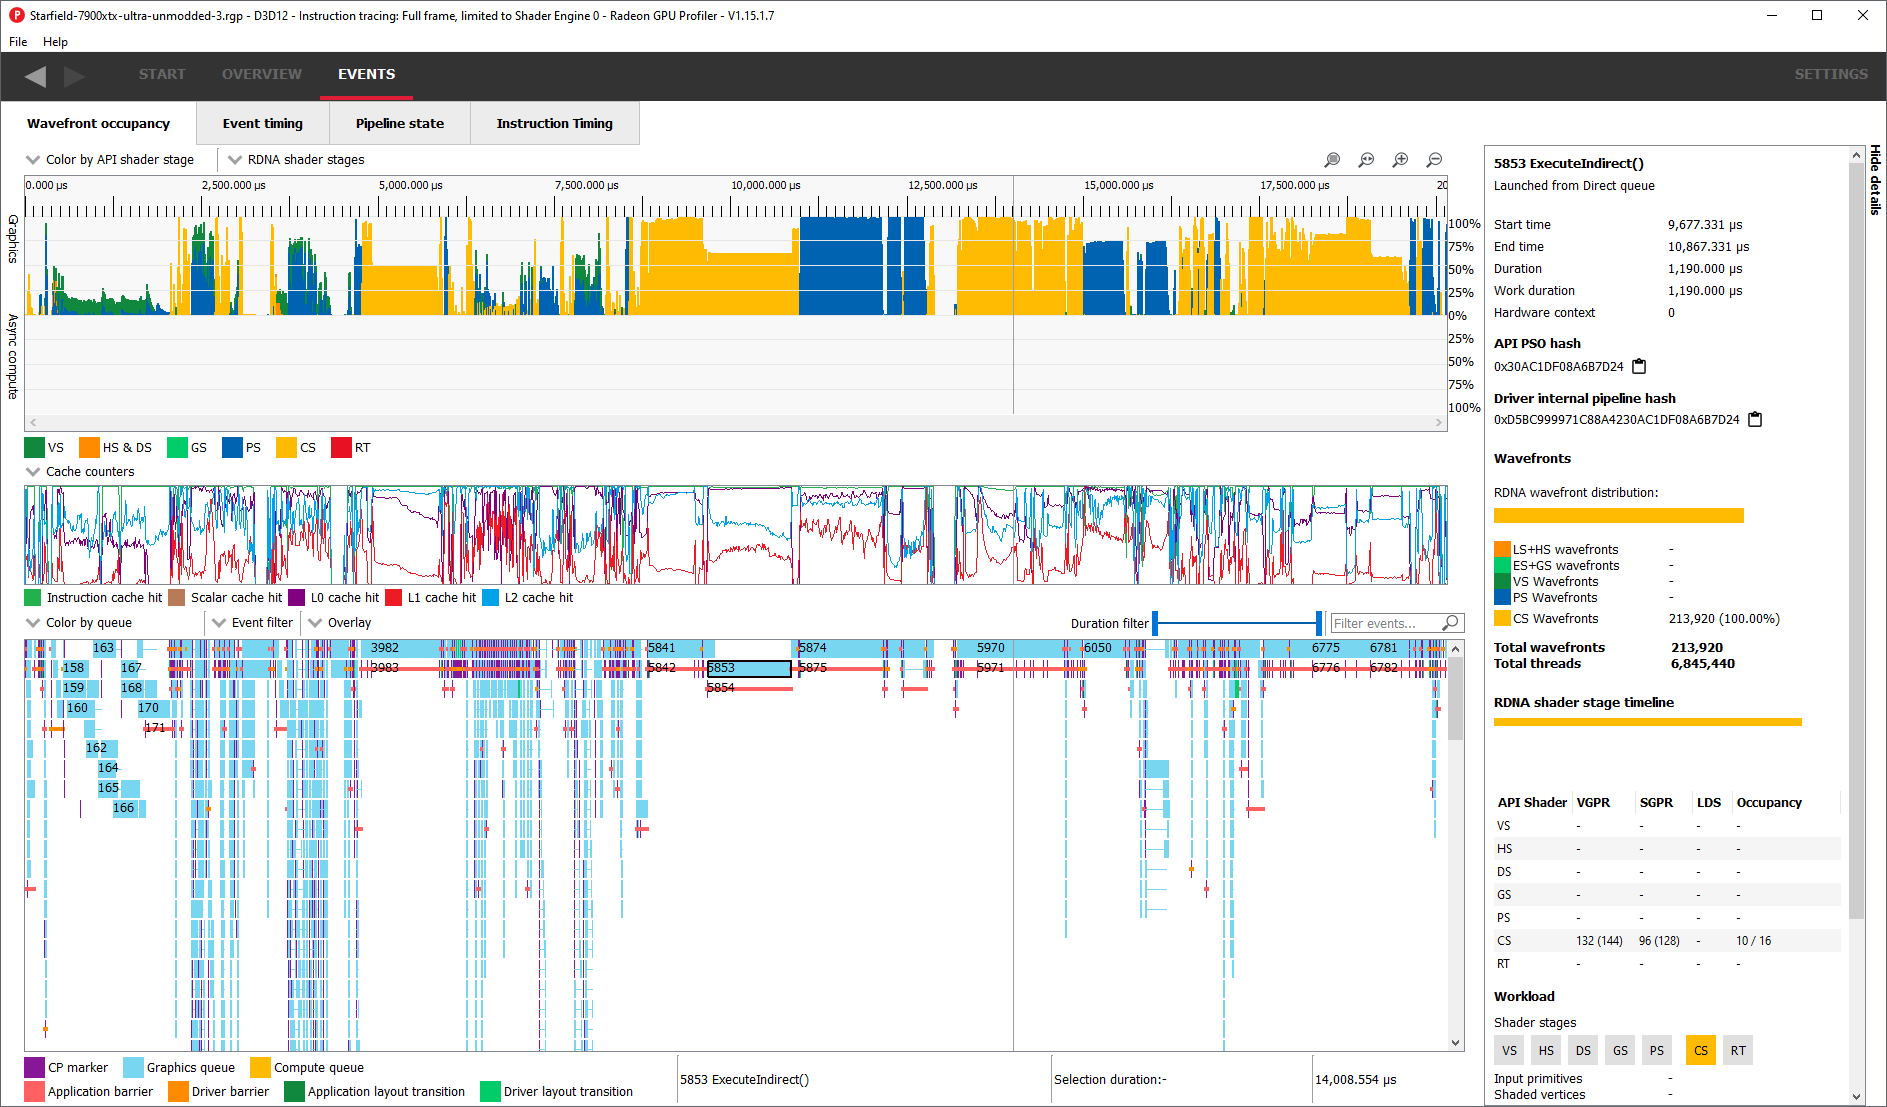
Our first target will be a Dispatch (compute) call that occurs near the middle of the frame, indicated with a red box:

The call takes just over 1.1 milliseconds on Nvidia and AMD’s fastest gaming GPUs. While AMD’s 7900 XTX lands behind Nvidia’s RTX 4090, the two GPUs are closer than you’d expect given Nvidia’s much larger shader array. Older cards take twice as long, and Turing especially suffers.

In terms of parallelism, the dispatch call operates on 6.8 million items, which are organized into 213 thousand wavefronts (analogous to a CPU thread) on RDNA 3. An RTX 4090 running at max occupancy would be able to track 6144 waves, while an RX 7900 XTX would track 3072. There’s more than enough work to go around for both GPUs.
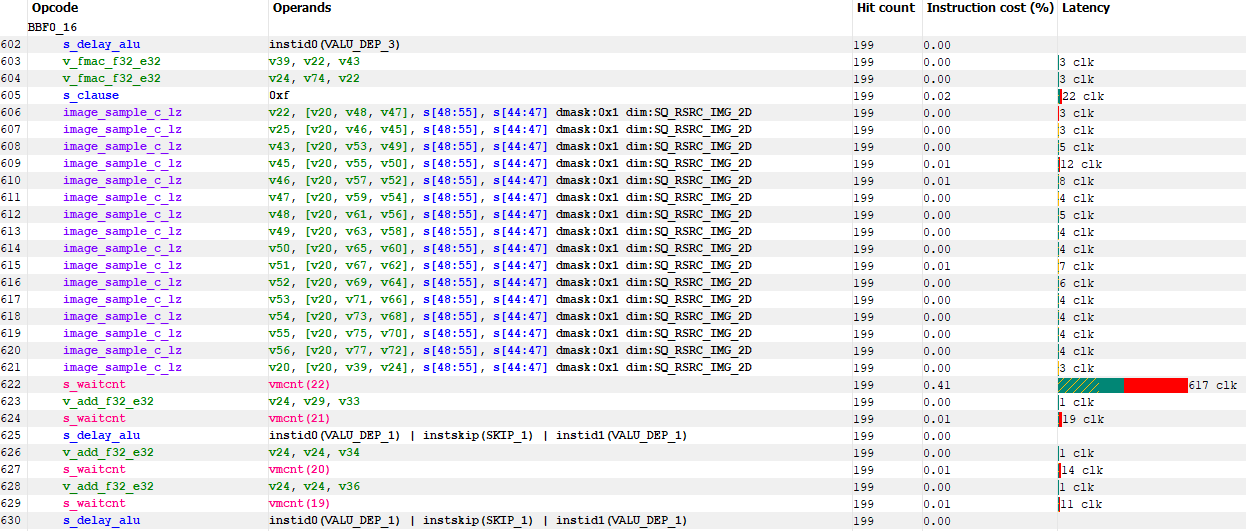
While this is a compute shader, it appears to be doing texture processing of some sort, because it features a good number of texture sampling instructions.
Right before the shader exits, it writes to textures as well:
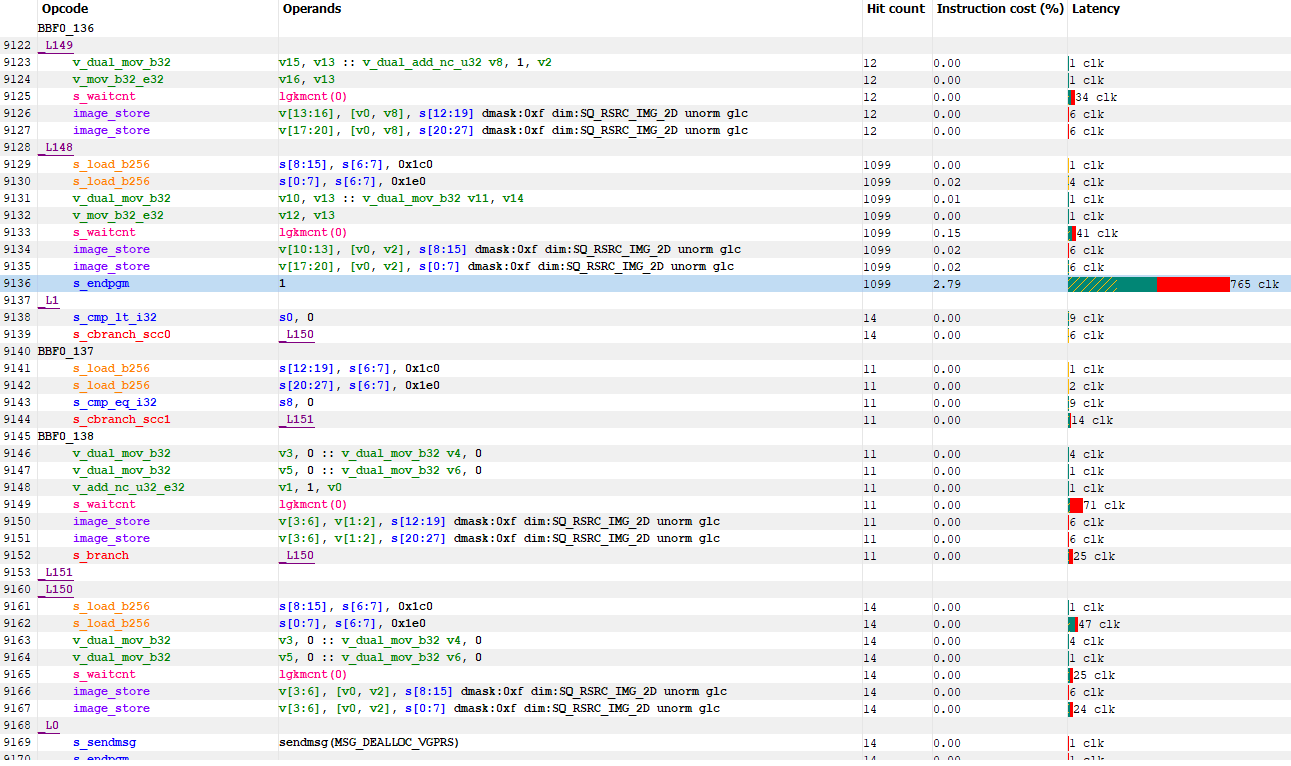
Without knowing more, I suspect this call is using compute to generate a texture that’s used later on in the rendering pipeline.
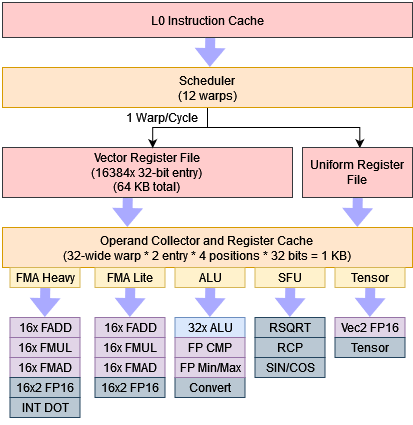
Shader Hardware Utilization
RGP and Nsight Graphics both report utilization with respect to hardware maximums, so it’s useful to think of this at the SIMD or SMSP level. AMD’s RDNA 3 GPUs are built from Workgroup Processors (WGPs). Each WGP has four SIMDs, each of which has its own register files, execution units, and a scheduler that can track up to 16 threads. By threads, I mean threads in the CPU sense where each thread has an independent instruction pointer. You can think of a SIMD as having 16-way SMT.
Nvidia GPUs are built from Streaming Multiprocessors (SMs), each of which are divided into four SM Sub-Partitions (SMSPs). Like a RDNA SIMD, each SMSP has a register file, execution units, and a scheduler. Ada and Ampere’s SMSPs can track up to 12 threads, while Turing’s can track up to eight.

On AMD’s RDNA 3, the vector ALU (VALU) metric is the most important, as vector computations are what GPUs are made for. The scalar ALU (SALU) pipe is used to offload computations that apply across the wave, like address generation or control flow operations. RDNA 3 enjoys very good vector utilization. Scalar ALUs do a good job of offloading computation, because the vector units would see pretty high load if they had to handle scalar operations too.
On Nvidia GPUs, the SM issue metric is a good place to start, as it indicates how often the scheduler was able to find an unstalled thread to issue an instruction from. Each SMSP can issue one instruction per cycle, so the utilization also corresponds to IPC on the SMSP level. Ampere and Ada see good utilization, though not as good as AMD’s. Turing’s situation is medicore. 26.6% issue utilization is significantly lower than what we see on the other tested GPUs.
Nvidia also organizes execution units into different pipes, suggesting an Ada or Ampere SMSP looks something like this:
I wouldn’t put too much weight into utilization for individual pipes unless it’s high enough to cause problems with issue utilization. In this case, utilization is low enough for individual pipes that they’re likely not a bottleneck.
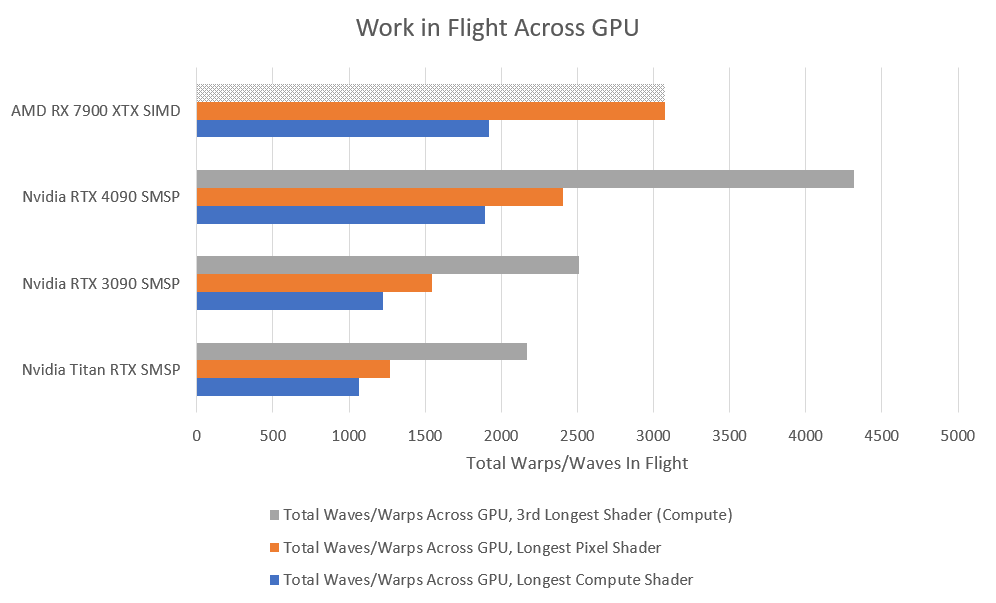
Occupancy
To explain the utilization figures, we can start by looking at occupancy. GPUs use thread level parallelism to keep themselves fed because they don’t have out-of-order execution. If one thread stalls, they switch to another one. More threads mean a better chance of keeping the execution units fed, just like how SMT on CPUs helps hide latency. Earlier, I mentioned that AMD SIMDs were basically sub-cores with 16-way SMT, while Nvidia’s SMSPs had 12 or 8-way SMT for Ampere/Ada or Turing. Occupancy refers to how many of those SMT threads are in use.
High occupancy isn’t required to get good hardware utilization. Just as CPUs can achieve max throughput with just one SMT thread active, all of the GPUs here are capable of maxing out their vector units with one thread in each SMSP or SIMD. However, cache access latency is very high on GPUs, so higher occupancy often correlates with better utilization.

None of the graphics architectures tested here achieve max occupancy, but AMD’s RDNA 3 enjoys a significant advantage. Register file capacity is to blame here. Unlike CPUs, these GPUs dynamically allocate register file capacity between threads, and how many threads you can have active often depends on how many registers each thread is using. AMD’s compiler chose to allocate 132 vector registers for this code, which rounds up to 144 registers because RDNA 3 allocates registers in blocks of 24. Each thread therefore requires 18.4 KB of vector registers (32 lanes * 4 bytes per register * 144 registers). A SIMD’s register file provides 192 KB of capacity – enough to hold state for 10 threads.

Each Nvidia SIMD has 64 KB of registers, and Nsight indicates waves couldn’t be launched to the shader array because no registers were available. Nvidia’s compiler likely gave each wave 128 registers, or 16 KB of register file capacity. Register allocation doesn’t differ much between AMD and Nvidia, but Nvidia’s much smaller register file means its architectures can’t keep as much work in flight per SIMD lane.
Caching
Keeping more work in flight helps a GPU cope with latency, but cutting down latency helps too. Just like CPUs, GPUs have evolved to feature complex multi-level cache hierarchies. VRAM technologies have not kept up with advances in GPU performance. Caches thus help GPUs keep their execution units fed by reducing how often they wait on VRAM.

RDNA 3, Ampere, and Ada all enjoy high first level cache hitrates. L2 hitrates are high as well. According to Nsight, the shader used 9.6%, 6.6%, and 11.4% of L2 bandwidth on the RTX 4090, RTX 3090, and Titan RTX respectively. We’re therefore mostly looking at L1 latency, and a bit of L2 latency. In prior articles, we measured L1 latency using vector accesses. However, latency there is probably not representative of latency seen in this shader because RDNA 3 shader disassembly shows there are a lot of texture accesses. Texture filtering incurs additional latency, which can be difficult to hide even if data comes from the first level of cache.

Nvidia’s Nsight Graphics lacks the ability to show shader disassembly, but their situation is probably similar.
The takeaway from this shader is that AMD’s RDNA 3 architecture is better set up to feed its execution units. Each SIMD has three times as much vector register file capacity as Nvidia’s Ampere, Ada, or Turing SMSPs, allowing higher occupancy. That in turn gives RDNA 3 a better chance of hiding latency. While L1 hitrates are good, high occupancy still matters because texture sampling incurs higher latency than plain vector accesses. But even though AMD is better at feeding its execution units, Nvidia’s RTX 4090 simply has a much larger shader array, and still manages to pull ahead.
Longest Duration Pixel Shader
Modern games continue to use rasterization as a foundation (even if they support raytracing), and pixel shaders are a crucial part of the rasterization pipeline. They’re resposible for calculating pixel color values and passing them down to the render output units (ROPs). Higher resolutions mean more pixels, which mean more pixel shader work.
The pixel shader in question was dispatched with 8.2 million invocations, which covers the entire 4K screen. Again, there’s more than enough parallelism to fill the shader array on all of these GPUs. Nvidia’s RTX 4090 comes out top, finishing the shader in 0.93 ms. AMD’s RX 7900 XTX is a tad slower at 1.18 ms. Prior generation GPUs are significantly behind with the 3090 taking 2.08 ms, and the Titan RTX taking 4.08 ms.

AMD’s RX 7900 XTX sees exceptionally high vector ALU utilization. This isn’t necessarily a good thing because such high utilization indicates a compute bottleneck. Nvidia’s Ampere and Ada Lovelace architectures see a more reasonable 60% utilization. They’re not under-fed, but aren’t compute bound either.

Turing again has lower utilization, but in isolation 35.9% is not bad. CPU execution ports often see similar utilization in high IPC workloads. Turing isn’t feeding itself badly, but it’s just not doing as well as more modern Nvidia GPUs.
Again, Nsight shows occupancy limited by register file capacity. Ada and Ampere do a very good job of keeping their execution units fed, considering each SMSP on average only had 4-5 threads to pick from to hide latency.

AMD’s compiler used 92 registers, which rounds up to 96 when we consider RDNA 3’s 24 register allocation granularity. That’s 12 KB of registers, which perfectly uses 192 KB SIMD vector register file. There’s a good chance Nvidia’s compiler chose the same number of registers, because theoretical occupancy appears to be 5 threads per SMSP. 5 threads * 12 KB of registers per thread comes out to 60 KB of register file capacity used. Nsight displays achieved occupancy rather than theoretical occupancy. Each SMSP could probably track 5 threads, but sometimes tracks slightly less because the work distribution hardware might not launch a new wave immediately when one finishes.

You can see the same phenomenon on RDNA 3, but RDNA 3 does seem slightly better at sending out work faster. AMD’s decoupled frontend clock could help with this, as it lets the work distribution hardware run at higher clocks than the shader array.
First level caches perform quite well. Nvidia enjoys slightly higher L1 hitrates because each SM has a larger L1 than AMD’s 32 KB L0. Nvidia does allocate L1 cache and shared memory (scratchpad) capacity out of the same block of SRAM, but that’s not an issue here. AMD didn’t use any scratchpad memory, and I suspect Nvidia didn’t either, so this shader probably got the maximum L1 allocation.

AMD’s lower L0 cache hitrate is mitigated by the 256 KB L1 mid-level cache. L1 hitrate by itself is not impressive, but it does mean AMD’s L2 likely sees less traffic than Nvidia’s. Cumulative L0 and L1 hitrate would be about 94.3% if we approximate by assuming L1 overall hitrate is a good representation of L1 data hitrate. It should be close enough because the L1 was mostly serving L0 miss traffic.
The takeaway from this shader is that AMD is able to achieve very high utilization thanks to very high occupancy. In fact, utilization is so high that AMD is compute bound. Nvidia hardware does well in this shader, but not quite as well because they again don’t have enough register file capacity to keep as much work in flight. However, Nvidia’s RTX 4090 still wins in absolute terms because it has so many more SMs.
Second Longest Compute Shader
Finally, let’s look at another compute shader. This one comes up third if we sort all events by duration, so it’s the third most significant shader overall.
This compute shader launches 2 million invocations, split into 32,400 wavefronts on RDNA 3. It’s a very interesting case because AMD’s 7900 XTX actually beats Nvidia’s RTX 4090. In the previous two shaders, the 7900 XTX merely got closer to Nvidia’s flagship than expected.

Even more interestingly, AMD does not enjoy the occupancy advantage we saw before. However, the situation is quite complicated because AMD opted to run this shader in wave64 mode, in contrast to the wave32 mode used before. Their compiler allocated a pretty moderate 93 (rounding up to 96) vector registers per thread. Wave64 means each thread is basically executing 2048-bit vector instructions, double pumped through each SIMD’s 1024-bit wide execution units. Certain common instructions can execute with full 1-per-cycle throughput even in wave64 mode, thanks to RDNA 3’s dual 32-wide execution units. However, using 64-wide vectors require twice as much register file capacity as 32-wide ones, so AMD’s SIMDs only have enough register file capacity to track eight threads at a time.

Nvidia can’t use a wave64 mode, and the green team’s compiler likely allocated fewer registers per thread as well. If we look just at occupancy, there’s not a lot of difference between the GPUs. Ada has a slight advantage and probably has a theoretical register-limited occupancy of 9 warps per SMSP. However, we have to remember that each wave64 thread on AMD has twice the SIMD width.

RDNA 3 enjoys very high utilization, and steps right on the line with regards to being considered compute bound. For reference, Nvidia considers a workload bound by a particular unit’s throughput if it’s achieving over 80% of theoretical performance. AMD doesn’t need higher occupancy. Nvidia’s GPUs see far lower utilization. The RTX 4090 sits just below 30%. Ampere and Turing are in a pretty good place, though notably Turing sees very high FMA pipe usage. Turing’s SMSPs can only issue FP32 operations every other cycle because each SMSP only has a single 16-wide FP32 pipe. Turing could become compute limited if it hit other bottlenecks first. That other bottleneck appears to be the L2 cache. L2 traffic was low enough to be a non-factor in the other two shaders and across most of the frame. But this compute call is different.

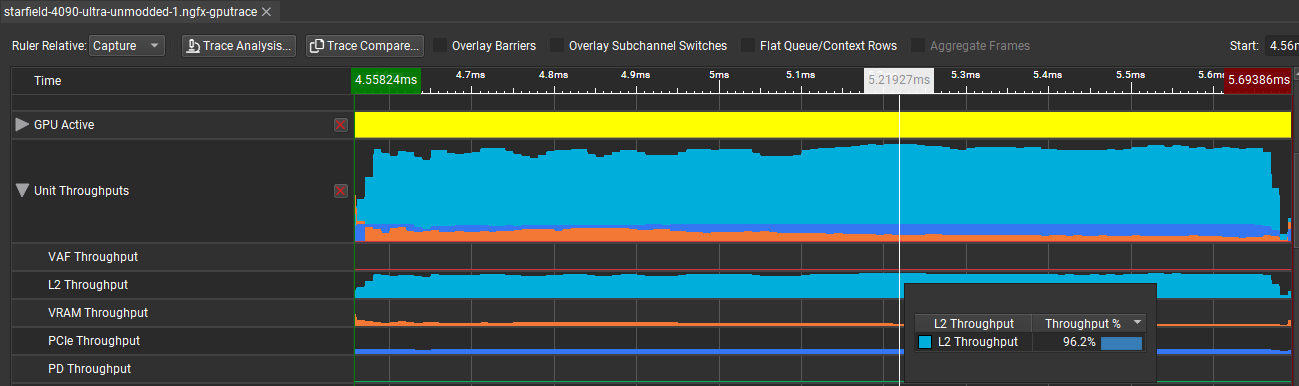
All GPUs cross the 80% threshold for being considered L2 bandwidth bound. However, the AMD figure comes with a caveat because RGP displays request counts instead of a percent of theoretical throughput. I approximated throughput utilization by multiply hit count by 128B cacheline size (giving 4.844 TB/s of L2 traffic), and divided by our previously measured figure of 5.782 TB/s for RDNA 3’s L2 cache. Measured figures usually can’t get close to 100% utilization, and a closer look at the BW scaling graph indicates it was probably measuring latency-limited bandwidth. Therefore, the 83.78% figure should be treated as an overestimate. I wouldn’t be surprised if real L2 bandwidth utilization was well under 80% on RDNA 3.
Across Nvidia’s GPUs, RTX 4090 looks especially bandwidth bound. Zooming in indicates the shader spends much of the time pushing well beyond 90% L2 bandwidth utilization.
Therefore, high occupancy doesn’t help Nvidia get better utilization than AMD. Earlier, I mentioned that higher occupancy doesn’t necessarily lead to better utilization, and this is one such case. Loading all SMT threads on a CPU won’t help you in bandwidth-limited scenarios, and GPUs are no different.

This compute shader has a larger hot working set than the prior ones, and L1 hitrate is lower across all three GPUs. Nvidia’s GPUs have a pretty hard time keeping accesses within their L1 caches. AMD somehow enjoys a higher hitrate for its small 32 KB L0 cache, though the larger 256 KB L1 barely enters the picture with a measly 13.5% hitrate.
L2 caches are large enough to catch the vast majority of L1 misses across all tested GPUs. Earlier, I assumed Nvidia’s RTX 4090 had enough L2 bandwidth to handle most workloads, so Nvidia’s simpler two-level cache hierarchy was justified. This shader is an exception, and L2 bandwidth limits prevent Nvidia’s much larger RTX 4090 from beating the RX 7900 XTX.
Comments on GPU Utilization
Like most games, Starfield is a complex workload that sees different demands throughout a frame. In the two longest duration shaders we looked at, AMD was able to leverage its larger vector register file to keep more work in flight per SIMD. That in turn gave it a better chance of hiding cache and execution latency.
However, quantity has a quality all of its own, and it’s hard to argue with 128 SMs sitting on a gigantic 608 mm2 die. AMD may be better at feeding its execution units, but Nvidia doesn’t do a bad job. 128 moderately well fed SMs still end up ahead of 48 very well fed WGPs, letting Nvidia keep the 4K performance crown. AMD’s 7900 XTX uses just 522 mm2 of die area across all its chiplets. To no one’s surprise, it can’t match the throughput of Nvidia’s monster even if we consider wave64 or wave32 dual issue.
In AMD’s favor, they have a very high bandwidth L2 cache. As the first multi-megabyte cache level, the L2 cache plays a very significant role and typically catches the vast majority of L0/L1 miss traffic. Nvidia’s GPUs become L2 bandwidth bound in the third longest shader, which explains a bit of why AMD’s 7900 XTX gets as close as it does to Nvidia’s much larger flagship. AMD’s win there is a small one, but seeing the much smaller 7900 XTX pull ahead of the RTX 4090 in any case is not in line with anyone’s expectations. AMD’s cache design pays off there.
Final Words
In summary there’s no single explanation for RDNA 3’s relative overperformance in Starfield. Higher occupancy and higher L2 bandwidth both play a role, as does RDNA 3’s higher frontend clock. However, there’s really nothing wrong with Nvidia’s performance in this game, as some comments around the internet might suggest. Lower utilization is by design in Nvidia’s architecture. Nvidia SMs have smaller register files and can keep less work in flight. They’re naturally going to have a more difficult time keeping their execution units fed. Cutting register file capacity and scheduler sizes helps Nvidia reduce SM size and implement more of them. Nvidia’s design comes out top with kernels that don’t need a lot of vector registers and enjoy high L1 cache hitrates.
If we look at the frame as a whole, the RTX 7900 XTX rendered the frame in 20.2 ms, for just under 50 FPS. Nvidia’s RTX 4090 took 18.1 ms, for 55.2 FPS. A win is a win, and validates Nvidia’s strategy of using a massive shader array even if it’s hard to feed. Going forward, AMD will need more compute throughput if they want to contend for the top spot.
If you like our articles and journalism, and you want to support us in our endeavors, then consider heading over to our Patreon or our PayPal if you want to toss a few bucks our way. If you would like to talk with the Chips and Cheese staff and the people behind the scenes, then consider joining our Discord.
 | A guest post by
|