Running SPEC CPU2017 at Chips and Cheese?
SPEC, or Standard Performance Evaluation Corporation, maintains and publishes various benchmark suites that are often taken as an industry standard. Here, I’ll be looking at SPEC CPU2017, which measures CPU performance. Chips and Cheese has a free press license for SPEC CPU2017, and we thank SPEC for graciously donating that. Running SPEC CPU2017 is interesting because OEMs often publish SPEC CPU2017 scores to set performance expectations for their systems, and SPEC CPU test suites are sometimes used as an optimization target by CPU makers.
Personally, I want to leave benchmarking to mainstream tech sites. Chips and Cheese is a free time project for me, meaning I have to pick the areas I want to cover. I started writing articles about hardware architecture because I felt mainstream sites were not covering that in anywhere near enough detail. But mainstream sites have important advantages. With people working full time, they’re far better positioned to run a lot of benchmarks and repeat runs should issues come up. But I may make an exception for SPEC CPU2017 because I don’t see more established sites running it, and we do have a license. Anandtech used to run SPEC CPU tests, but unfortunately they’ve closed down.
SPEC CPU2017 is a particularly challenging benchmark to run. It’s distributed in source code form to let it run across a broad range of systems. But that means compiler selection and optimization flags can influence results. Running SPEC CPU2017 also takes a long time once compilation finishes. A run can take several hours even on a fast CPU like the Ryzen 9 9950X. On Ampere Altra, a run took more than 11 hours to complete. Testing different compilers and flags, and doing multiple runs to collect performance counter data can easily turn into a giant time investment.
Here, I’m going to share my early impressions of running SPEC CPU2017. Nothing here is final including the test methodology, or whether I’ll actually run SPEC CPU2017 going forward.
Acknowledgment
We would like to thank the SPEC organization for giving us a SPEC CPU 2017 license for us to use free of charge.
Initial Run Configuration
My initial methodology is loosely based off Anandtech’s. However, I’m using GCC 14.2.0 instead of clang. Like Anandtech, I want to skip working with vendor specific compilers like AMD’s AOCC, Intel’s ICC, and Arm’s armclang. I know that many submitted SPEC results use vendor specific compilers, and they may give better scores. But working out flags for each compiler is not a time investment I’m willing to make. I also want to focus on what scores look like with a standard, widely deployed compiler. I did look at clang, but it wasn’t able to compile some SPEC workloads out of the box. GCC wasn’t able to either, but SPEC already documented workarounds for most of the problems I encountered. The rest were fixed by passing -Wno-implicit-int and -Wno-error=implicit-int to GCC, and -std=legacy to GFortran. clang threw more complex errors that didn’t immediately lead me to an obvious debugging route.
As with compiler selection, I’m keeping optimization flags simple:
-O3 -fomit-frame-pointer -mcpu=native
I’m using -O3 instead of -Ofast as Anandtech did, because -Ofast causes a failure in SPEC2017’s floating point suite. -mcpu=native is a compromise so I don’t have to pass different tuning and ISA feature targets for different CPUs. On aarch64, -mcpu=native tells GCC to target the current CPU’s ISA feature set and tune for it. On x86-64 however, -mcpu=native only tells GCC to tune for the current CPU. When I have more time, I do intend to see what’ll happen if I split out -march and -mtune options. -fomit-frame-pointer tells the compiler to not use a register to store the stack frame pointer if a function doesn’t need it, freeing a register up for other uses. I’m only including it because Anandtech used it. From brief testing, Zen 4 had identical scores with and without the flag. Ampere Altra got a 1.2% higher integer score with -fomit-frame-pointer, which is negligible in my opinion.
I’ll be focusing on single threaded results by running a single copy of the rate tests. SPEC CPU2017 allows running multiple copies of the rate tests, or speed tests that use multiple threads to measure multithreaded performance. I think that’s a bridge too far because I’ve already sunk too much time into getting single threaded test results. Finally, I’m using bare metal Linux except in cloud environments where virtualization isn’t avoidable.
Initial Results
Results are marked “estimated” because they haven’t been submitted to SPEC’s site.
For reference, here are Anandtech’s results from their last article on the Ryzen 9 9950X:
At a glance, scores are reasonable. My runs on the Ryzen 9 9950X scored 8.6% and 11.7% higher than Anandtech’s in the integer and floating point suites, respectively. If I use my Ryzen 9 7950X3D’s non-VCache die as a proxy for the Ryzen 9 7950X, my runs scored 6.2% and 7.3% higher in integer and floating point. That difference can be partially explained by faster memory. Cheese set the Ryzen 9 9950X test system up with DDR5-6000, while Anandtech used DDR5-5600. On my system, I’m using DDR5-5600. Anandtech didn’t specify what they tested Zen 4 with. Compiler selection and flags may also have made a difference, as GCC is a more mature compiler.
The SPEC CPU2017 scores actually indicate how fast the tested system is compared to a 2.1 GHz UltraSPARC IV+ from 2006, with tests compiled by Oracle Developer Studio 12.5. Current consumer cores are more than 10x faster than the old UltraSPARC IV+. Even a density optimized core like Crestmont still posts a more than 5x performance advantage.
Diving into Subtests
SPEC CPU2017’s floating point and integer suites are collections of workloads, each with different characteristics. I want to understand how each workload challenges the CPU’s pipeline, and what bottlenecks they face. First, let’s look at the scores.
Modern CPUs post huge gains over the UltraSPARC IV+ across the board, but 548.exchange2 is an outlier in the integer suite. Outliers get even more extreme in the floating point suite. Even the FX-8150, which was infamously bad at single threaded performance, obliterates the UltraSPARC IV+ in 503.bwaves.
To avoid cluttering graphs and limit time expenditure, I’ll focus on Redwood Cove and Zen 5 for performance counter analysis. They’re the most modern Intel and AMD architectures I have access to, and their high performance means runs can complete faster.
Within the integer suite, 548.exchange2, 525.x264, and 500.perlbench are very high IPC workloads. IPC is very low in 505.mcf and 520.omnetpp. Zen 5 and Redwood Cove have broadly similar IPC patterns across the test suite.
SPEC CPU2017’s floating point suite generally has higher IPC workloads. 538.imagick has very high IPC in particular. 549.fotonik3d sits at the other end, and shows low IPC on both Zen 5 and Redwood Cove.
Performance Counter Data
Top-down analysis tries to account for lost throughput in a CPU’s pipeline. It measures at the narrowest stage, where lost throughput can’t be recovered by bursty behavior later. 505.mcf and 520.omnetpp are the lowest IPC workloads in the integer suite, making them interesting targets for analysis.
On Zen 5, omnetpp is heavily limited by backend memory latency. 505.mcf’s situation is more complex. Frontend latency is the biggest limiting factor, but every other bottleneck category plays a role too.
Intel’s Redwood Cove is balanced differently than Zen 5. 520.omnetpp gets destroyed by backend memory latency, likely because Meteor Lake has a higher latency cache and memory hierarchy. In 505.mcf, Redwood Cove is also more memory bound. But Intel also loses far more throughput to bad speculation. That’s when the frontend sends the core down the wrong path, usually due to branch mispredicts.
Performance counters show Intel and AMD’s branch predictors have a hard time in 505.mcf. Technically 541.leela challenges the branch predictor even more, but only 16.47% of leela’s instruction stream consists of branches. 505.mcf is a branch nightmare, with branches accounting for 22.5% of its instruction stream. Normalizing for that with mispredicts per instruction shows just how nasty 505.mcf is.
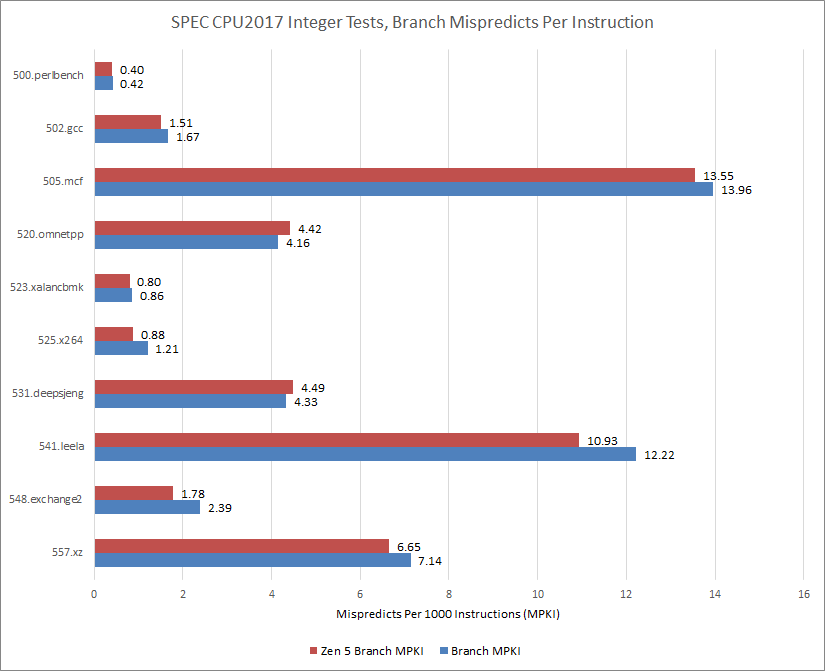
Mispredicted branches also incur frontend latency because the frontend has to clear out its queues and eat latency from whichever level of cache the correct branch target is at. Thankfully, 505.mcf’s instruction footprint is pretty tame. The test fits within the micro-op cache on both Zen 5 and Redwood Cove.
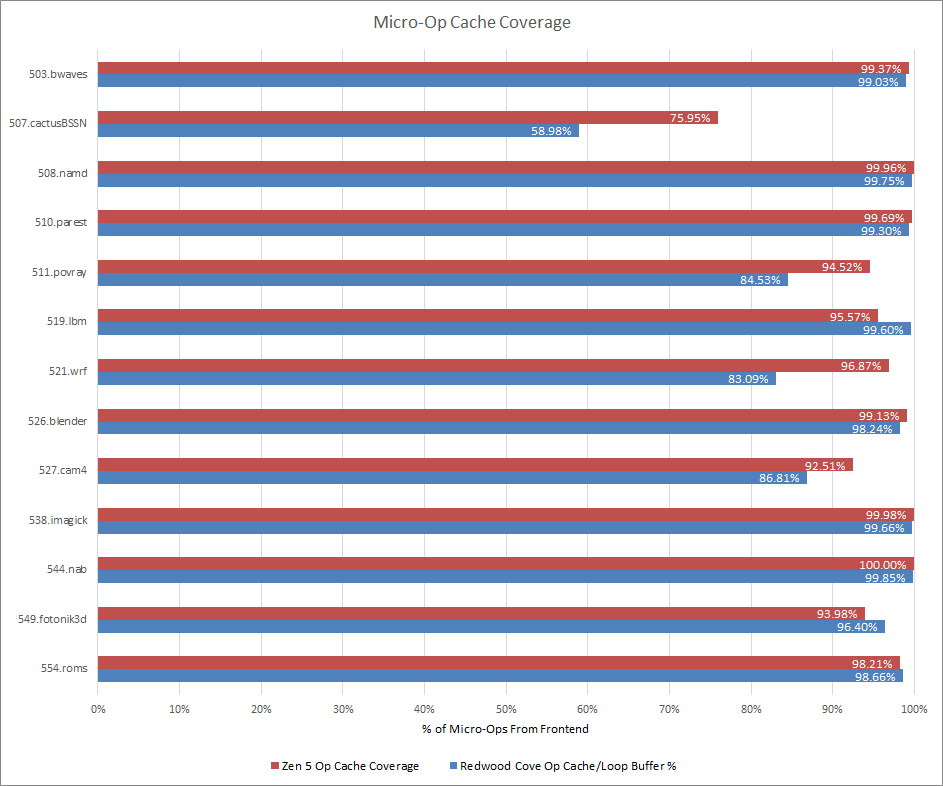
I find it interesting that Zen 5 suffers hard from both frontend latency and bandwidth even when using its fastest method of instruction delivery. Zooming back up, Intel and AMD’s latest micro-op caches are big enough to contain the majority of the instruction stream across SPEC CPU2017’s integer suite. Zen 5 does especially well, delivering over 90% of micro-ops from the micro-op cache even in more challenging workloads like leela and deepsjeng.
505.mcf
At this point, I decided 505.mcf was interesting enough to warrant further investigation. Redwood Cove’s frontend situation makes sense. High micro-op cache hitrate keeps frontend latency and frontend bandwidth bottlenecks under control, but mispredicts cause a lot of wasted work. Zen 5’s situation is more difficult to understand, because frontend latency plays a huge role even though the op cache is the lowest latency source of instruction delivery.
L1 instruction cache misses aren’t a significant factor. High op cache hitrate already implies that, but it’s good to make sure. Because instruction-side cache miss latency shouldn’t be a factor, it’s time to look at branches. 505.mcf has a ton. Returns and indirect branches account for a minority of them.
Zen 5 can’t do zero-bubble branching for returns and indirect branches with changing targets. Those should have minor impact because they only account for a small percentage of the instruction stream. However, Zen 5 uses its indirect predictor more than twice for every indirect branch that shows up in the instruction stream.
Speculative events like how often the core uses its indirect predictor are expected to count higher than retired events (instructions committed at the end of the pipeline). Mispredicts will always cause extra wasted work. The branch predictor may predict an indirect branch, then have to do it again if a branch right before that was mispredicted. But a more than 2x count is suspiciously high. Add returns and direct branches that miss the L1 BTB, and you have about 72.8 branch predictor delays per 1000 instructions.
I suspect these delays cause Zen 5 to suffer more from frontend latency than Redwood Cove. But those delays may also mean Zen 5 doesn’t get as far ahead of a mispredicted branch before it discovers the mispredict. Redwood Cove loses less from frontend latency, but that simply means it sends more wasted work to to the backend.
Redwood Cove also suffers more from backend memory bound reasons in 505.mcf. Its L1 data cache sees a lot of misses, as does its L1 DTLB. Intel’s events count at retirement, and therefore exclude prefetches or erroneously fetched instructions that were later flushed out.
Most misses are caught by second and third level caches, which incurs extra latency. However, DRAM latency is always a nasty thing especially with LPDDR5. 1.97 L3 MPKI might not seem too bad, but DRAM takes so long to access that it ends up accounting for the bulk of memory-bound execution delays. Intel’s cores can track when all of their execution units were idle while there’s a pending cache miss.
An execution stall doesn’t necessarily impact performance because the execution stage is a very wide part of the pipeline. The core could momentarily have a lot of execution units busy once cache miss data shows up, minimizing or even completely hiding a prior stall. But I expect these memory bound stalls to correlate with how often a cache miss leads to a dispatch stall at the renamer, after which the core will never recover the lost throughput.
Memory Bandwidth Usage
Memory latency can be exacerbated by approaching bandwidth limits. That’s typically not an issue from a single core, and bandwidth usage across across the integer suite is well under control. 505.mcf does have the highest bandwidth usage across the integer tests, but 8.77 GB/s is not high in absolute terms. So while Redwood Cove’s caches struggle a bit more with 505.mcf than in other tests, it’s still doing its job in avoiding memory bandwidth bottlenecks.
Another observation is that write bandwidth often accounts for a small minority of bandwidth usage. Read bandwidth is more important.
Floating point tests often follow the same pattern, with low bandwidth usage and not a lot of writes. But a few subtests stand out with very high memory bandwidth usage, and more write bandwidth too.
549.fotonik3d and 503.bwaves are outliers. From both IPC data above and top-down analysis data below, 503.bwaves isn’t held back by memory bandwidth. IPC is high, and backend memory-bound stalls are only a minor factor. 549.fotonik3d however suffers heavily from backend memory stalls. It eats 21 GB/s of read bandwidth and 7.23 GB/s of write bandwidth. For perspective, I measured 23.95 GB/s of DRAM bandwidth from a single Redwood Cove core using a read-only pattern, and 38.92 GB/s using a read-modify-write pattern. 549.fotonik3d is heavily bound by memory latency, but memory latency in this case is high because the workload is approaching bandwidth limits for a single core.
Besides being more bandwidth heavy, SPEC CPU2017’s floating point tests tend to be more core bound than the integer ones. And as the higher IPC would imply, more pipeline slots result in retired (useful) work. Generally, the SPEC CPU2017 floating point tests make better use of core width than the integer ones, and move emphasis towards execution latency and throughput. Zen 5 shows similar patterns, though AMD’s latest core still suffers a bit from frontend latency.
Micro-op cache hitrates are generally high, except in 507.cactuBSSN. It’s the only test across SPEC CPU2017 that sees Zen 5 drop below 90% micro-op cache hitrate. Redwood Cove gets hit harder, with micro-op cache hitrate dropping to 58.98%.
Still, both cores suffer very little in the way of frontend bandwidth or latency losses in 507.cactuBSSN. Missing the micro-op cache doesn’t seem to be a big deal for either core. Part of this could be because branches account for just 2.22% cactuBSSN’s instruction stream and both cores enjoy over 99.9% branch prediction accuracy. That makes it easy for the branch predictor to run far ahead of instruction fetch, hiding cache miss latency. It’s a stark contrast to 505.mcf, and suggests having branchy code is far worse than having a large instruction footprint.
Backend Memory Footprint
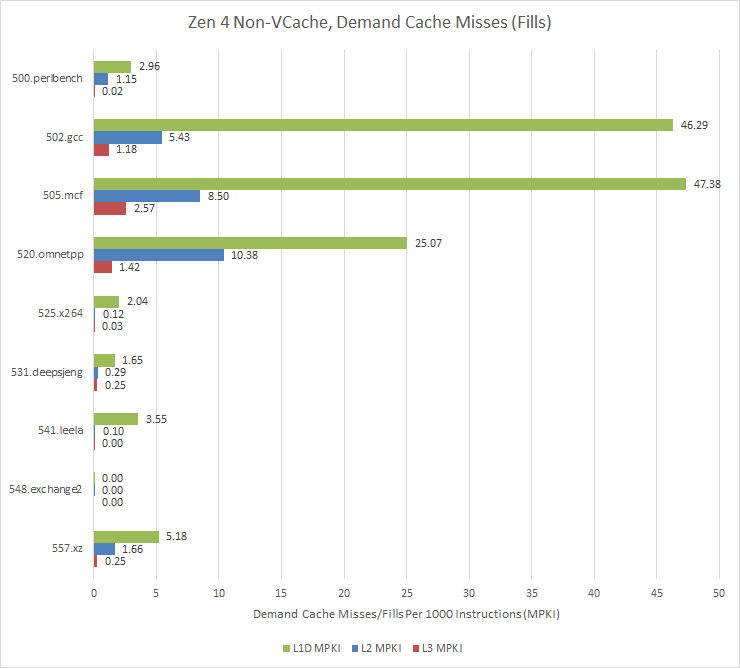
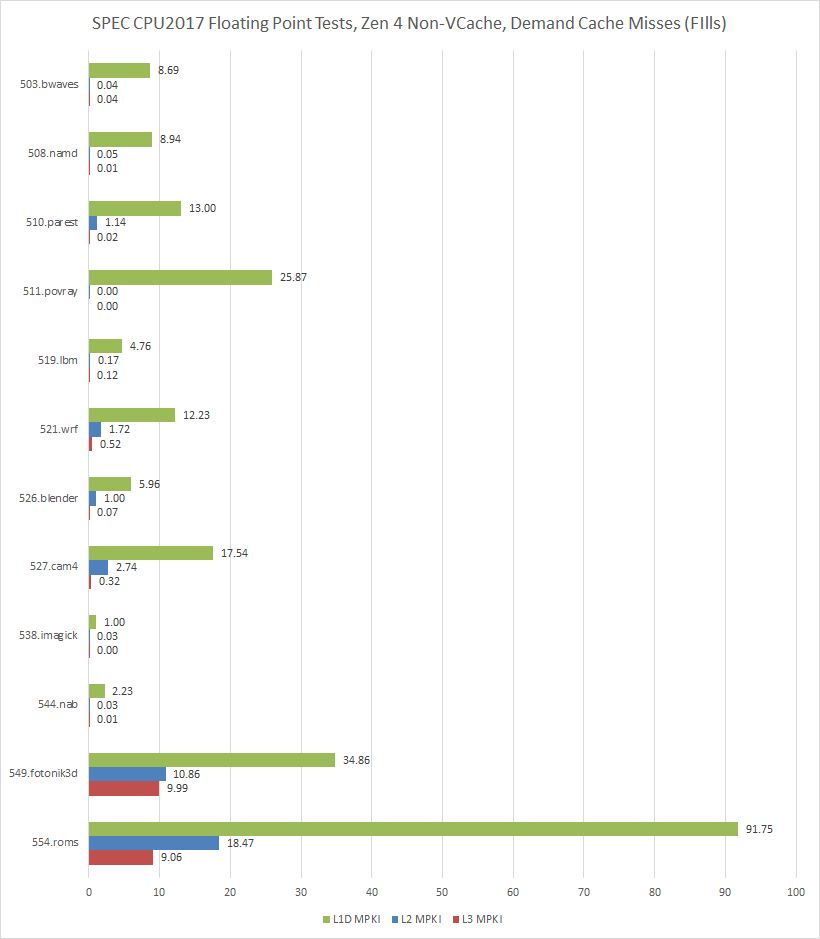
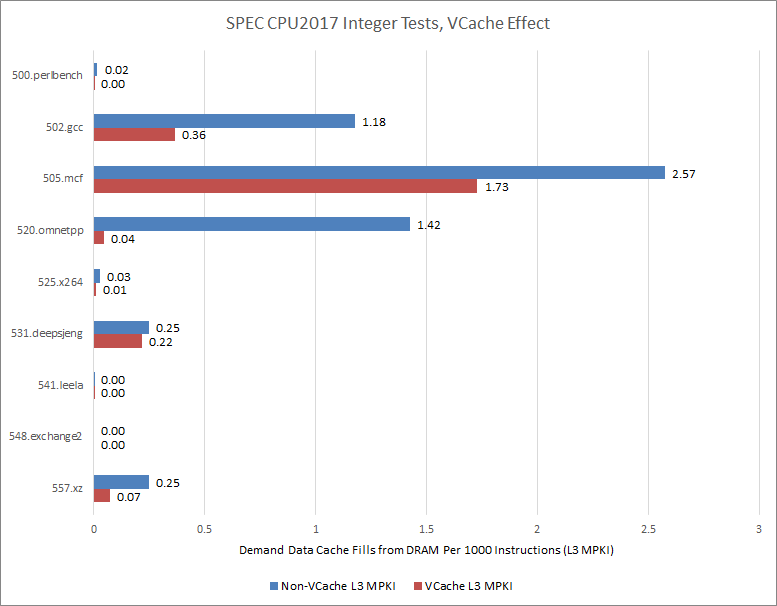
Micro-op cache coverage is pretty good throughout much of SPEC CPU2017’s test suite. But backend memory latency and occasionally memory bandwidth play a role too. Caches help mitigate those issues, insulating cores from slow DRAM. I collected demand cache fill data on Zen 4 because the 7950X3D lets me check the impact of more L3 cache without changing other variables. “Demand” means an instruction initiated a memory access, as opposed to a prefetch. However, a demand access might be started by an instruction that was never retired, like one flushed out because of a branch mispredict. Intel in contrast reports load data sources at retirement, which excludes instructions fetched down the wrong path. Therefore, figures here aren’t comparable to Redwood Cove data above.
L1D miss rate is surprisingly low across a large portion of SPEC CPU2017’s integer tests. 548.exchange2 is the most extreme case, fitting entirely within the L1 data cache. It also enjoys 98.89% micro-op cache hitrate on Zen 4, explaining its very high 4.1 IPC. Other tests that take a few L1D misses often see those misses satisfied from L2 or L3. 502.gcc, 505.mcf, and 520.omnetpp are exceptions, and challenge the cache hierarchy a bit more.
The same pattern persists across many floating point tests. Zen 4’s 32 KB L1D sometimes sees more misses, but again L2 and L3 are extremely effective in catching them. 549.fotonik3d and 554.roms are extreme exceptions with very high L3 miss rates. There’s nothing in between.
That likely explains why VCache does poorly in the floating point suite. 96 MB of L3 will have little effect if 32 MB of L3 already covers a workload’s data footprint. If the data footprint is too large, 96 MB might not be enough to dramatically increase hitrate. Then, higher clock speed from the non-VCache die may be enough to negate the IPC gain enabled by VCache.
Increased L3 hitrate in 549.fotonik3d and 554.roms produced a 17% IPC increase, which should have been enough to offset VCache’s clock speed loss. However, the lower score suggests the tested VCache core did not maintain its top clock speed during the test.
The integer suite is a little more friendly to VCache. 520.omnetpp is a great example, where a 96 MB L3 cache is nearly able to contain the workload’s data footprint. The resulting 52% IPC increase is more than enough to negate the non-VCache core’s clock speed advantage.
Still, many tests fit within L3 and therefore punish VCache’s lower clock speed. The total integer score sees VCache pull even with its non-VCache counterpart, which isn’t a good showing when the VCache die almost certainly costs more to make.
Final Words
Running SPEC CPU2017 was an interesting if time consuming exercise. I think there’s potential in running the test for future articles. The floating point and integer suites both have a diverse set of workloads, and examining subscores can hint at a CPU’s strengths and weaknesses. At a higher level, the integer and floating point tests draw a clear contrast where the former tends to be more latency bound, and the latter tends to be more throughput bound.
I have criticisms though. Many of SPEC CPU2017’s workloads have small instuction footprints, meaning they’re almost entirely contained within the micro-op cache on recent CPUs. From the data side, many tests fit within a 32 MB L3 or even a 1 MB L2. The floating point suite’s tests are either extremely cache friendly or very bound by DRAM bandwidth and latency.
And of course, there’s no getting away from the time commitment involved. Having a run fail several hours in because -Ofast caused a segfault in a floating point subtest is quite a frustrating experience. Even if everything works out, getting the info I want out of SPEC CPU2017 can easily take several days on a fast system.
Going forward, I might include SPEC CPU2017 runs if the settings above work across a wide variety of systems. That’ll let me reuse results across articles, rather than having to do multiple runs per article. If I end up having to go down a rabbit hole with different compilers and flags, I’ll probably stick to benchmarks that are easier to run. And of course, I’ll continue poking at architecture details with microbenchmarks.
If you like our articles and journalism, and you want to support us in our endeavors, then consider heading over to our Patreon or our PayPal if you want to toss a few bucks our way. If you would like to talk with the Chips and Cheese staff and the people behind the scenes, then consider joining our Discord.



Why are you only posting specRATE results? Those make no sense when comparing single-thread performance