
Evaluating Geekbench 6

Applications vary wildly in what they demand from a system, making it difficult for a single benchmark to provide a broadly representative score. Benchmark suites try to address this by running a set of workloads that hopefully capture a range of typical application behavior. SPEC CPU2017 is an industry standard benchmark suite that dates back to 1989. Geekbench is another suite with a more recent history, going back to around 2010 if I remember correctly. Unlike SPEC CPU2017, Geekbench has a strong consumer focus. It’s distributed in binary form like most consumer applications, rather than source code form like SPEC CPU2017. Geekbench’s test harness and test runtimes also prioritize accessibility and ease of use.
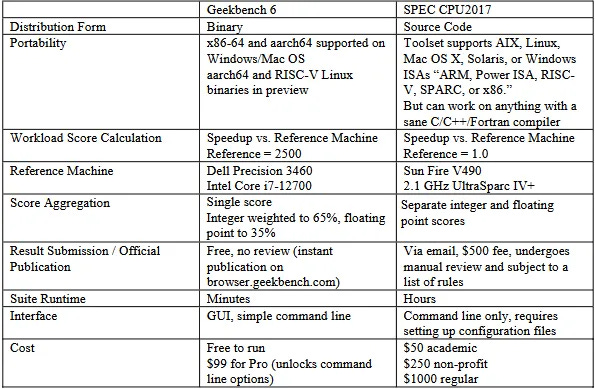
Those differences make Geekbench 6 an interesting suite to evaluate alongside SPEC CPU2017. I looked at SPEC CPU2017 on Chips and Cheese several years ago. Now, I have a license for Geekbench 6 courtesy of Primate Labs’s founder, John Poole. It’s time to dig into the challenges Geekbench 6 workloads present for modern CPUs.
Instruction Composition
Because it’s distributed in binary form, Geekbench 6 can easily target ISA-specific features. Here, I’m running various workloads through Intel’s Software Development Emulator, which provides exact instruction counts and can emulate different ISA extensions without regard to what hardware it’s running on. With Intel’s Granite Rapids as an ISA target, AVX-512 plays a prominent role in Background Blur, Object Detection, and Structure from Motion. Granite Rapids represents Intel’s latest server platform, and comes with support for AMX for matrix multiplication acceleration. AMX shows up in Object Detection and Photo Library, where it accounts for 0.2% and 0.02% of executed instructions, respectively.
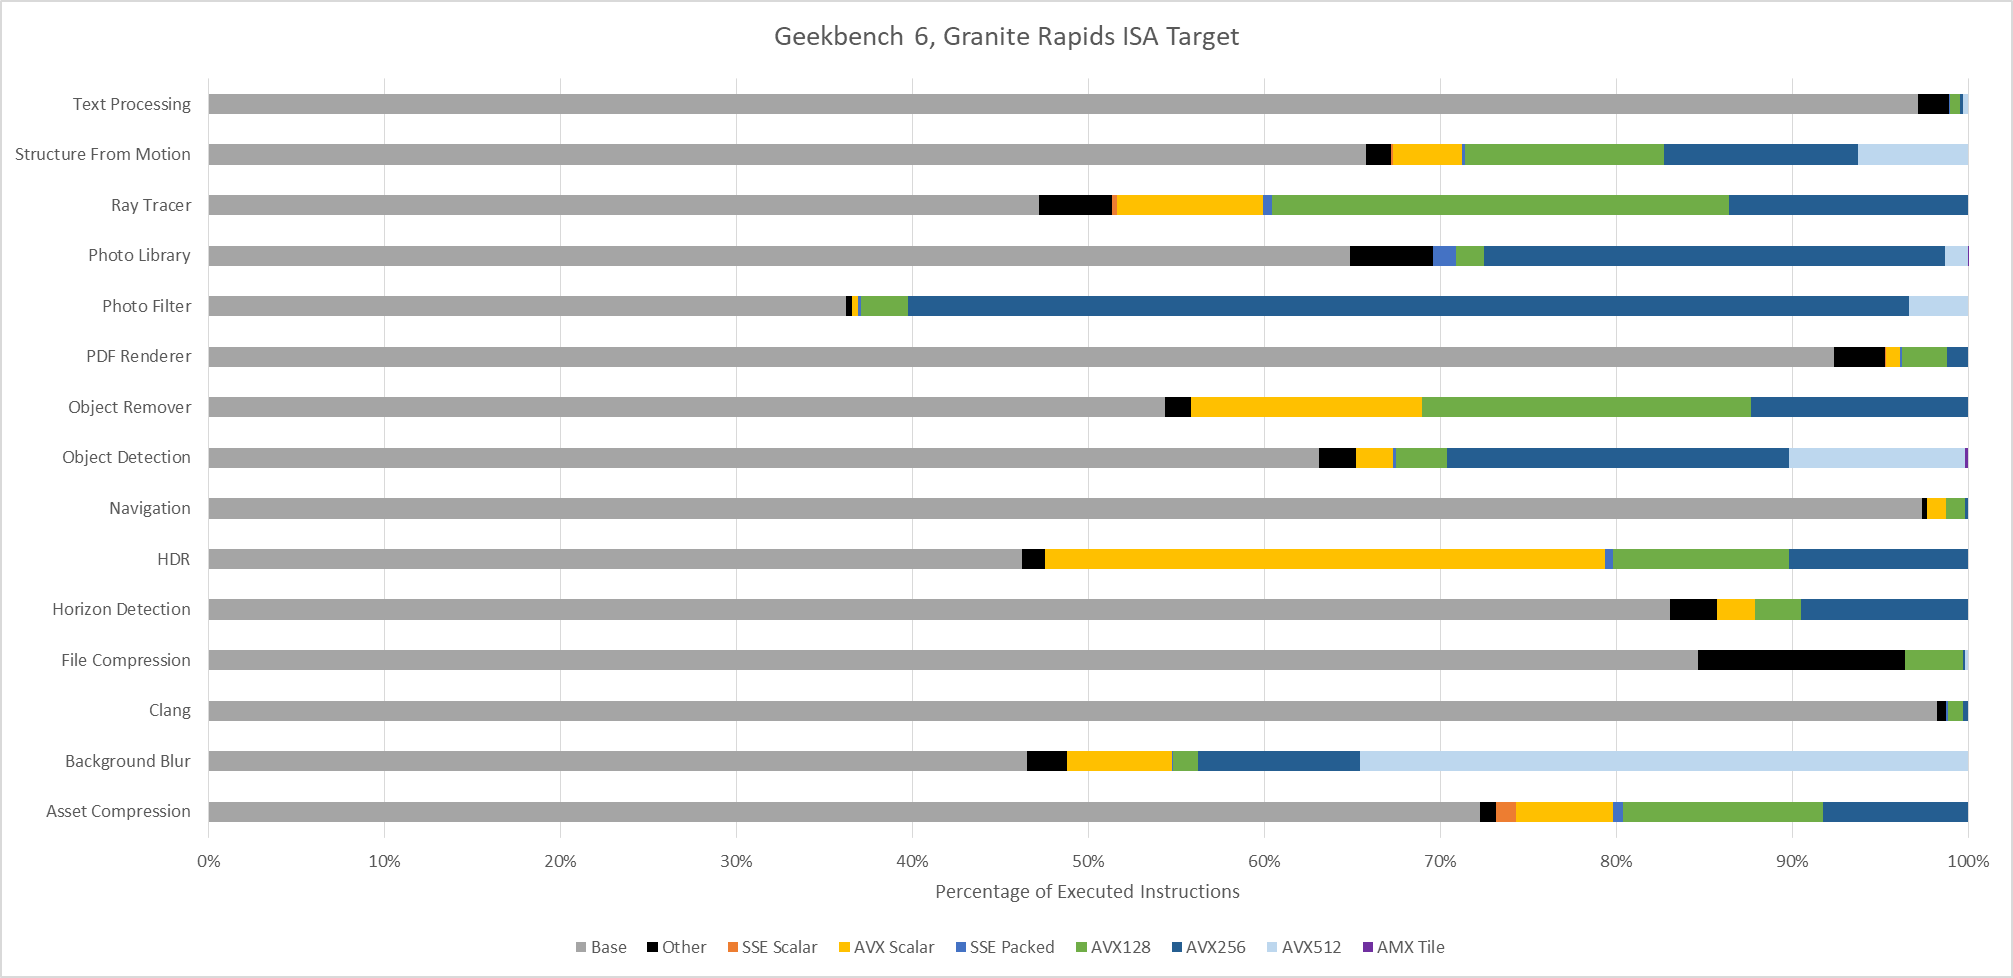
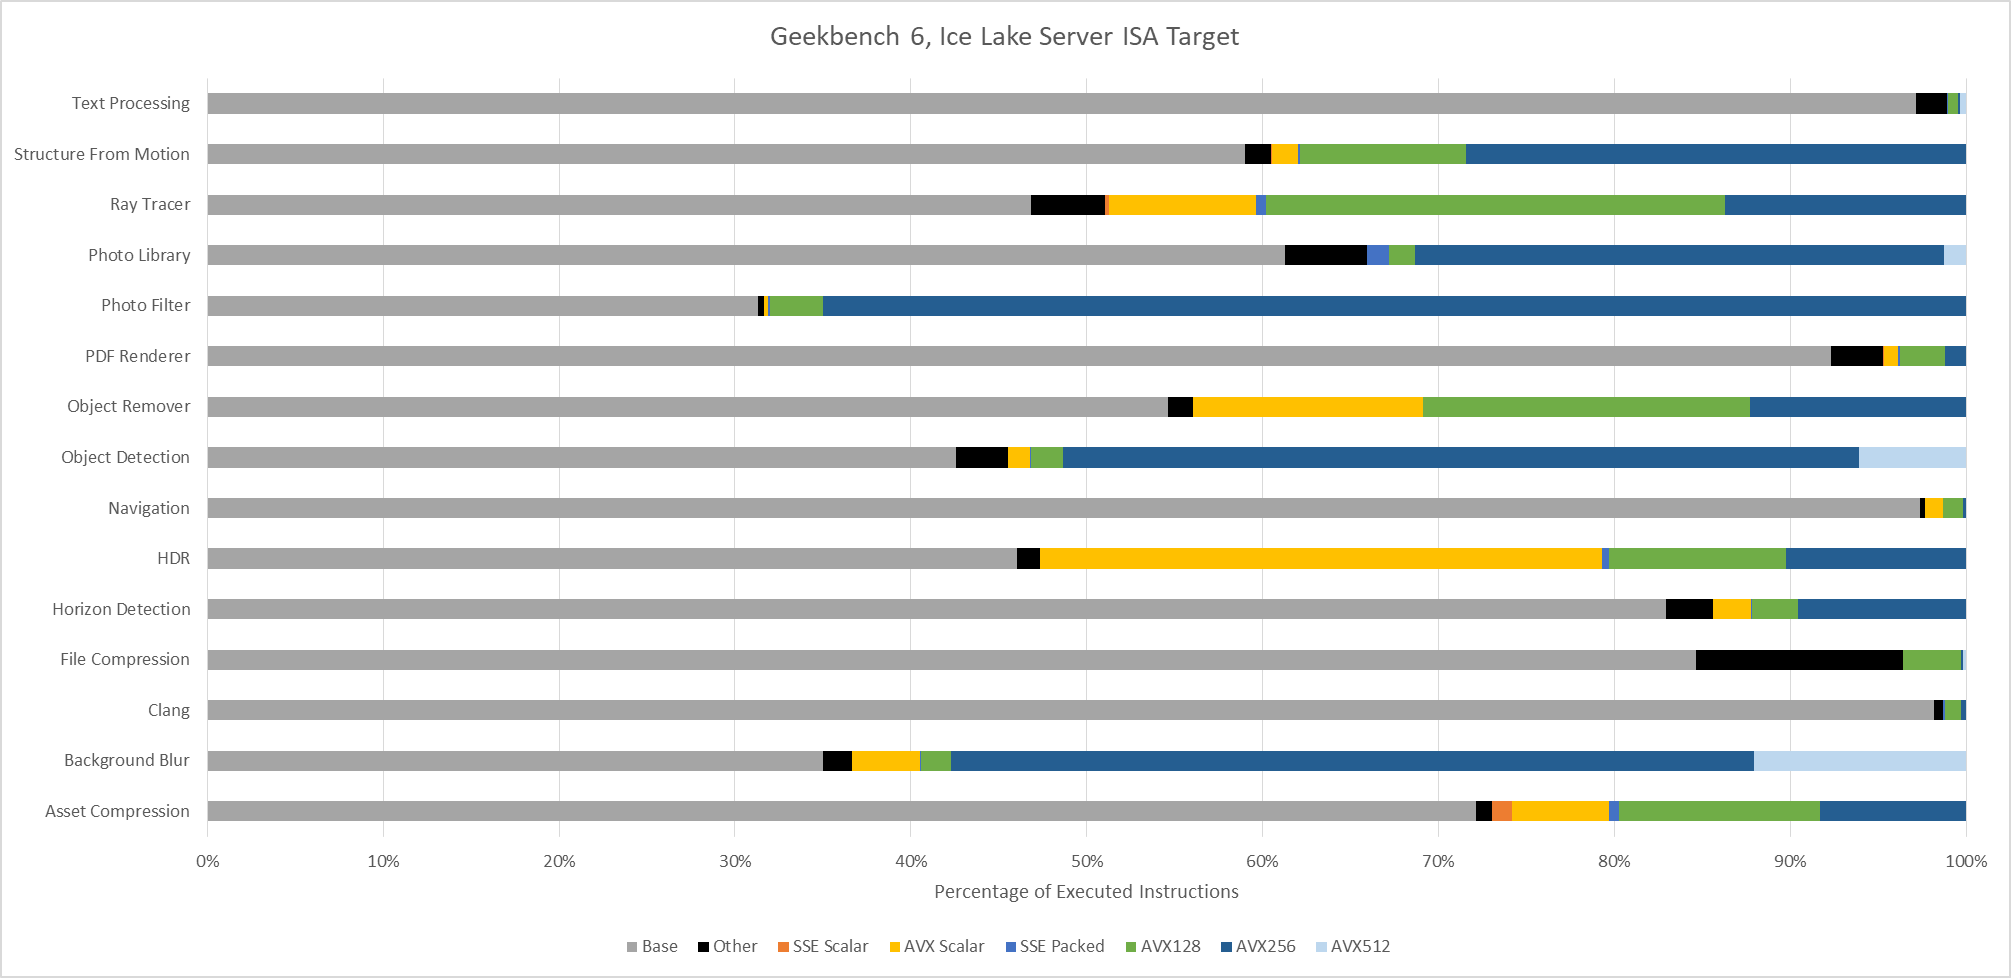
Even though AMX accounts for a small minority of executed instructions, AMX has an outsized impact. Ice Lake X represents an AVX-512 capable ISA target without AMX. Comparing results from Ice Lake X and Granite Rapids targets show that AMX can dramatically drop the number of AVX2 and AVX-512 instructions required to do the same work. Other tests show little to now difference between those two ISA targets, as expected.
AVX(2) has a huge presence across Geekbench 6 workloads, to the point that it’s easier to name workloads that aren’t heavily vectorized than ones that are. Text Processing, File Compression, Clang, and PDF Renderer don’t have much vectorization. Everything else uses plenty of 128-bit or 256-bit vectors.
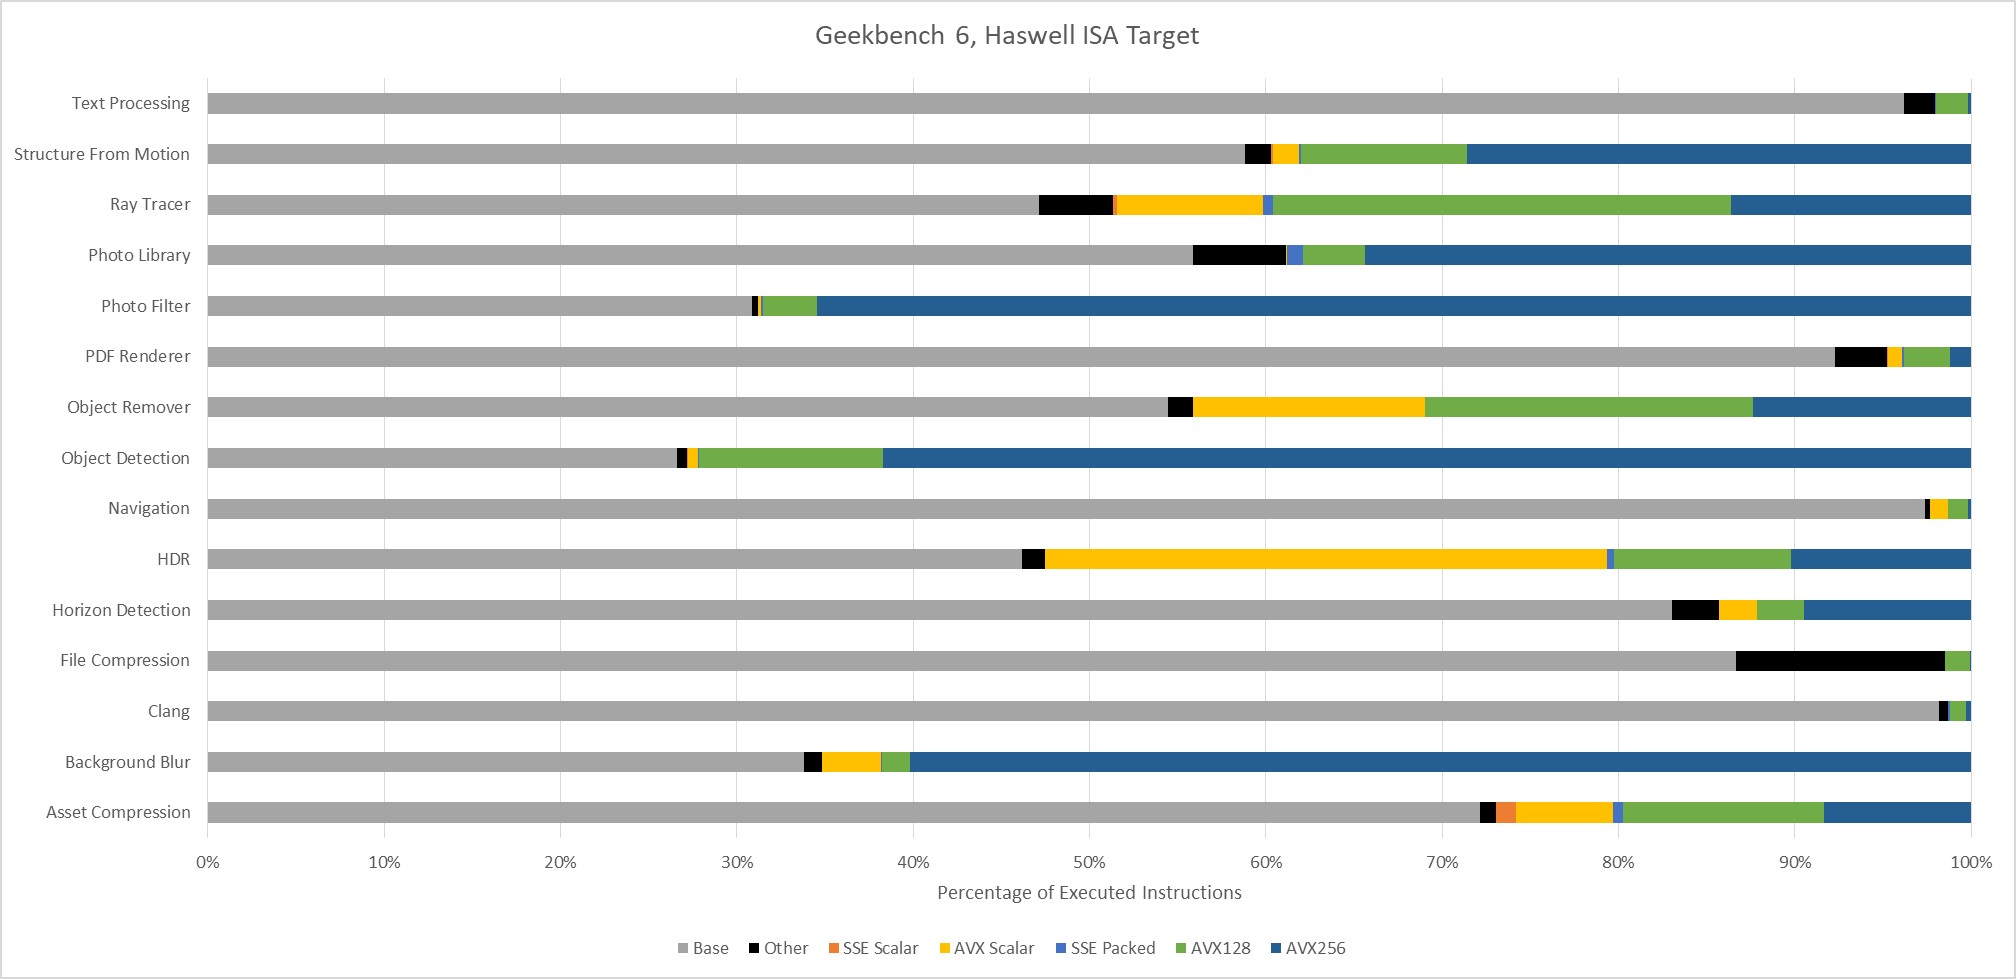
Moving to Haswell gives an AVX2 capable baseline with no AVX-512 support. The three heavy AVX-512 workloads see those AVX-512 instructions replaced by more AVX2 ones. Object Detection is a particularly prominent example, with 256-bit AVX2 dominating the instruction stream.
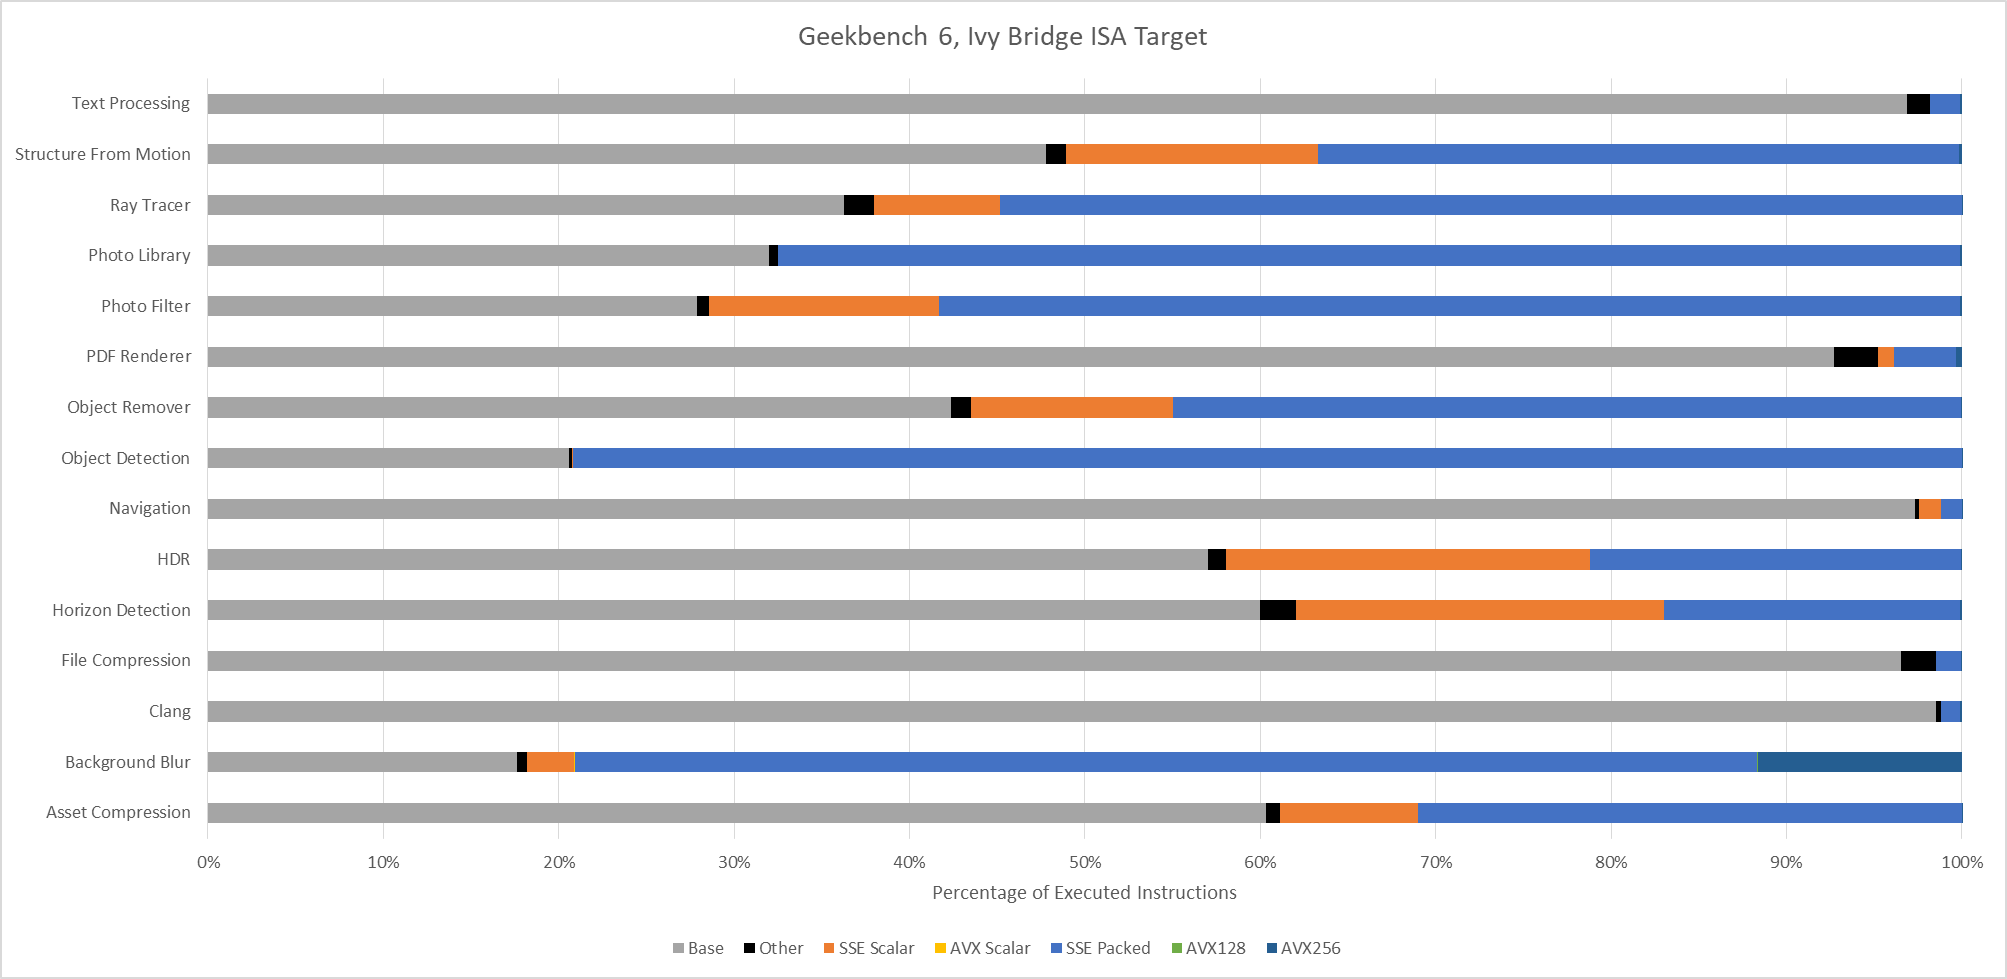
An Ivy Bridge ISA target gives an idea of what happens with AVX support, but not AVX2. AVX provides 256-bit vector registers and 256-bit load/store operations, but 256-bit vector math operations are limited to floating point. With SDE emulating an Ivy Bridge ISA target, the executed instruction stream skews heavily towards 128-bit packed SSE operations. 256-bit AVX still shows up in many workloads, but accounts for less than 1% of executed instructions across most of them. Only Background Blur makes heavy use of 256-bit AVX.
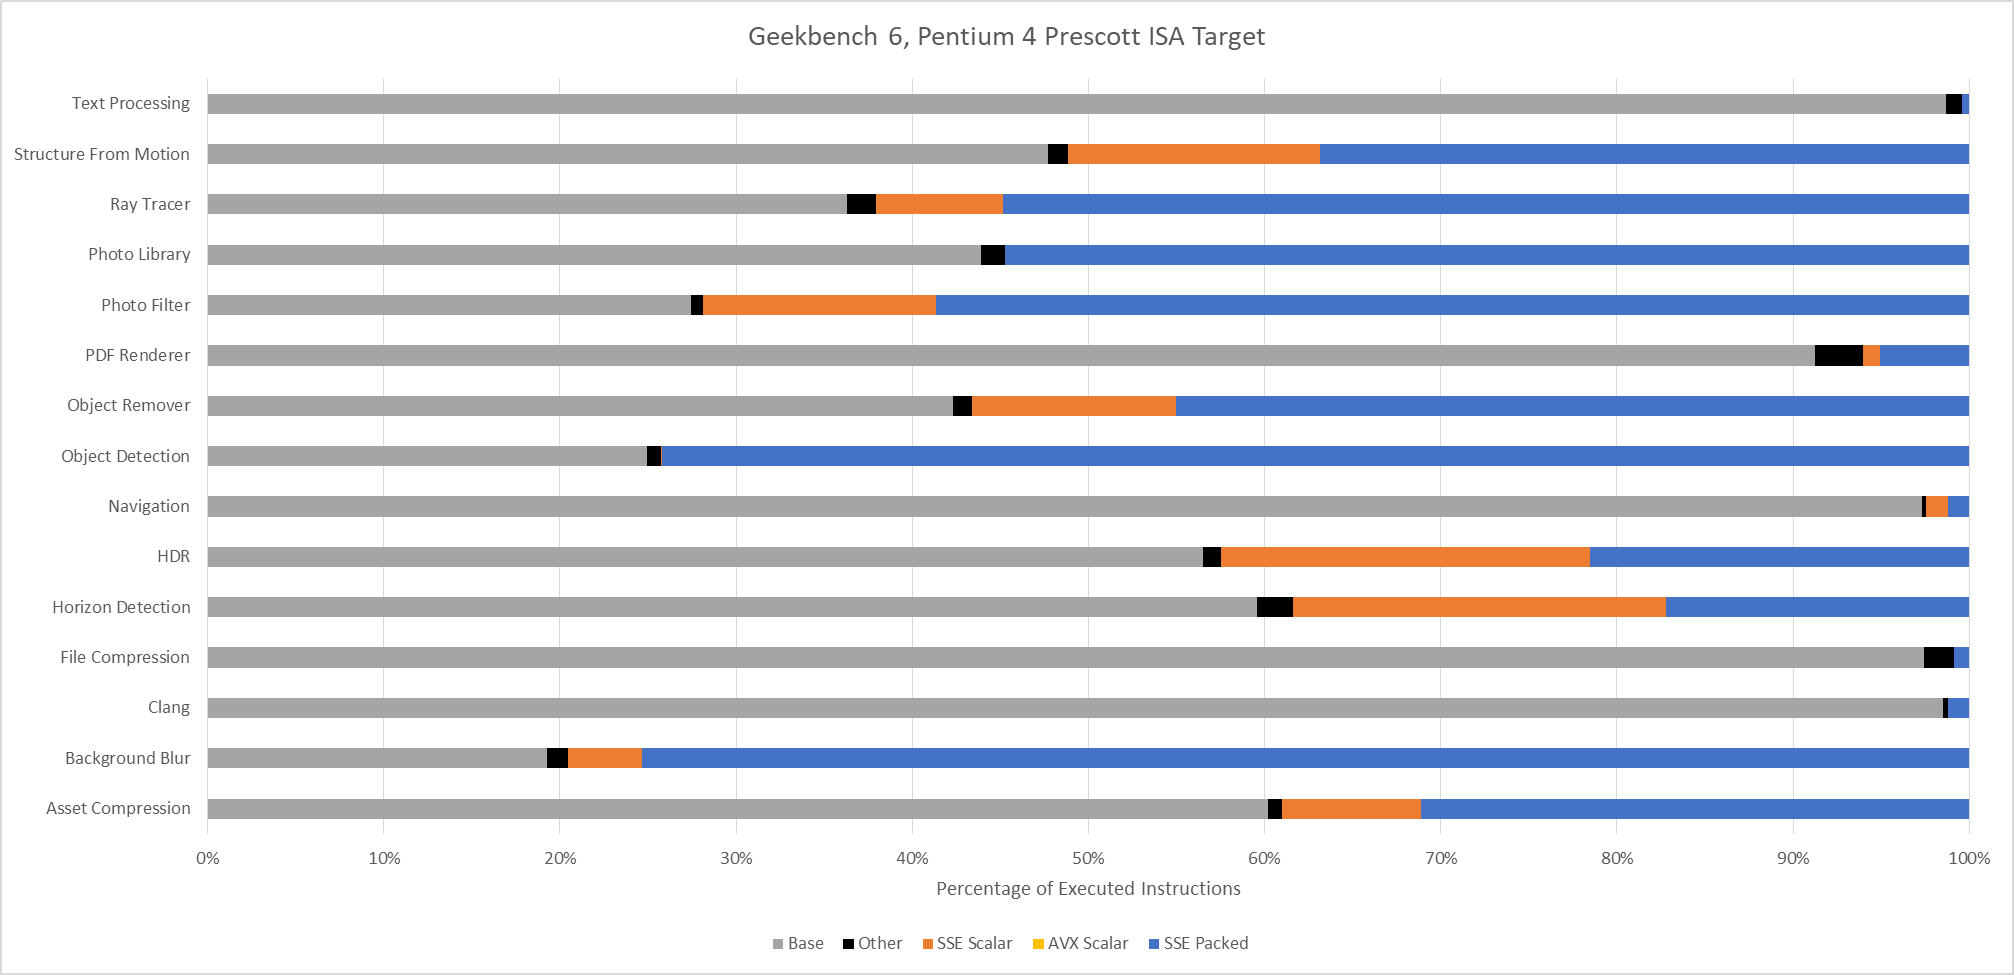
Lastly, Intel’s Pentium 4 “Prescott” represents an x86-64 baseline from long ago. It’s mostly here for curiosity, as there are likely very few systems in service limited to this level of ISA extension support. The executed instruction distribution is surprisingly close to that of Ivy Bridge. 128-bit packed SSE operations dominate across most workloads.
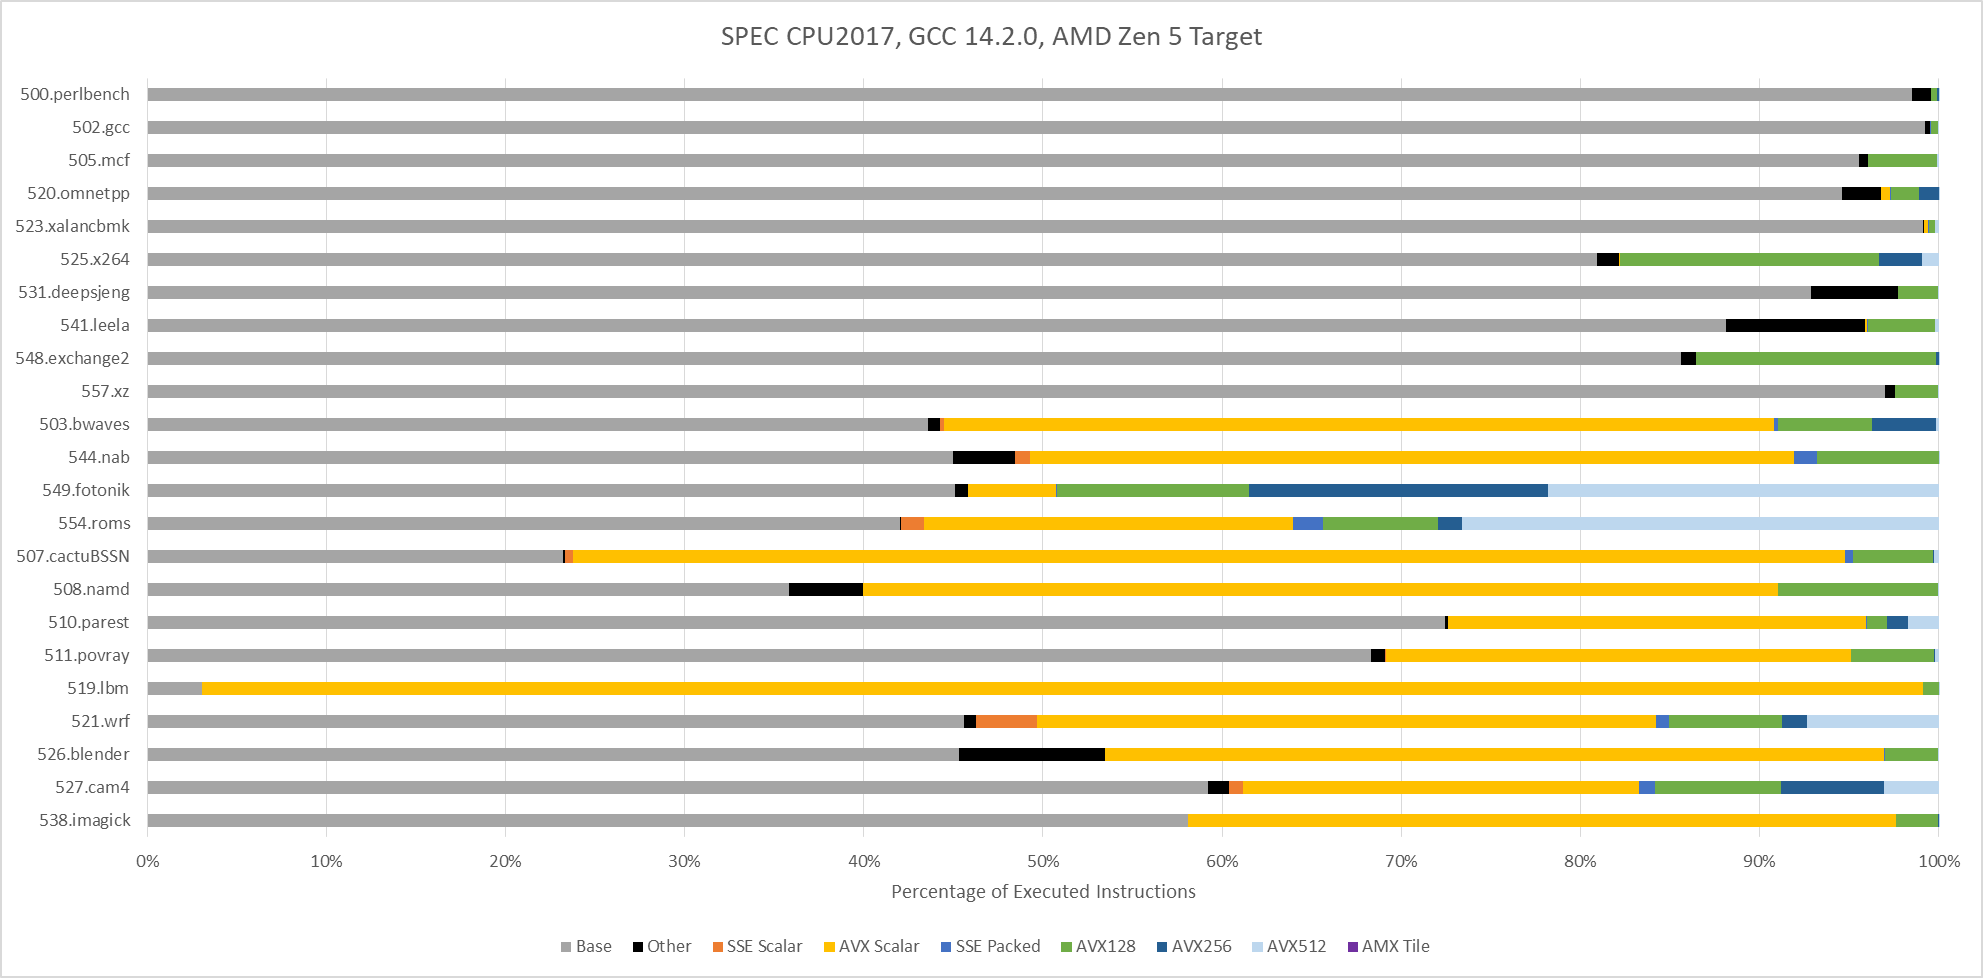
SPEC CPU2017 doesn’t explicitly target ISA features, including vector extensions. To maximize portability, SPEC CPU relies on compilers to find opportunities to use ISA features. With GCC 14.2.0 compiling for an AVX-512 capable target (Zen 5), vector ISA extensions do show up in a few floating point tests. 549.fotonik3d and 554.roms execute a lot of AVX-512 instructions. Elsewhere, auto-vectorization plays a comparatively minor role. It’s almost absent in SPEC CPU2017’s integer suite, except in 525.x264 and 548.exchange2. Those two workloads use some 128-bit vectors.
Assessing Workload Difficulty: IPC
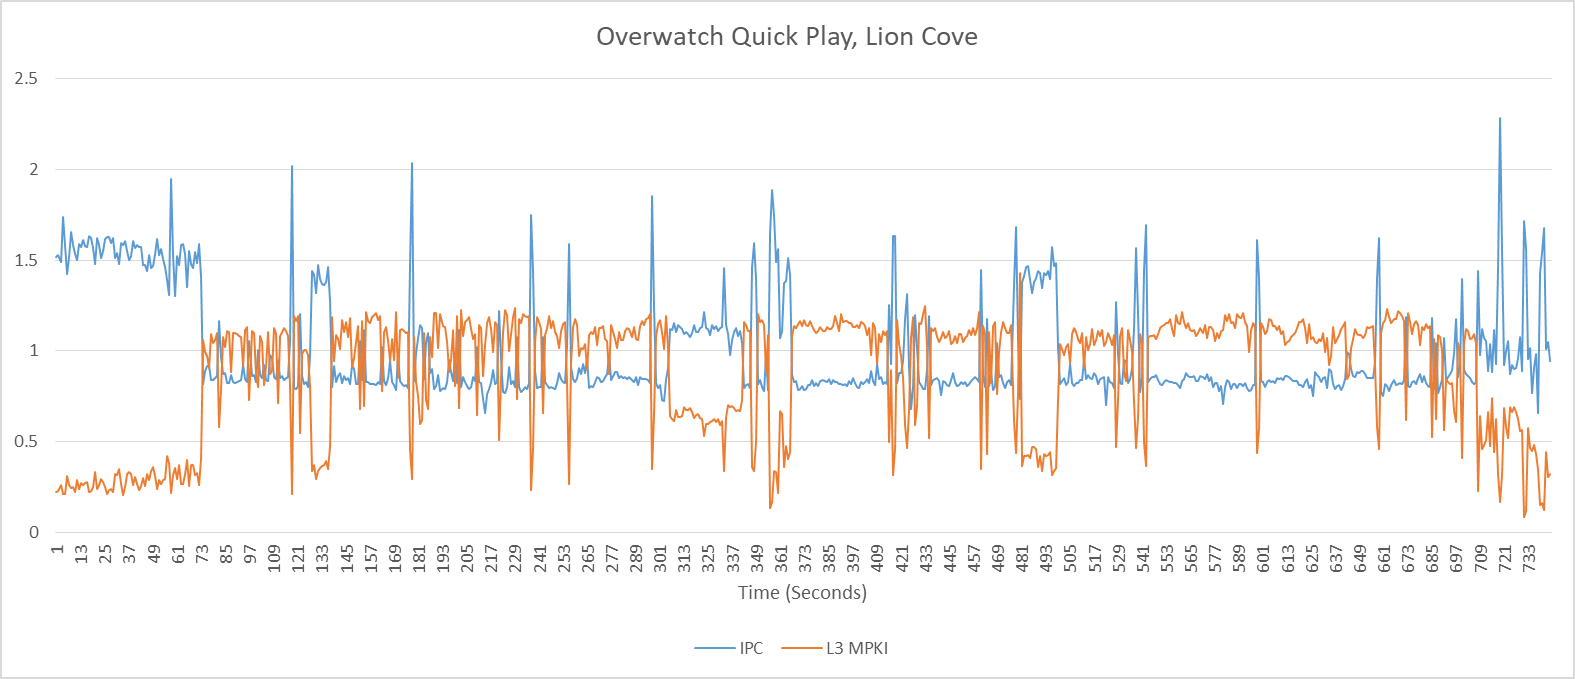
Instructions per cycle gives a quick overview of how “difficult” a workload is, for lack of a better word. Low IPC often indicates a workload is bound by branch mispredicts or cache misses, or less often, by hitting a particular deficiency in the core. Games for example tend to be low IPC workloads, bound primarily by the memory subsystem. High IPC in contrast points to a well fed core, with focus shifting to how fast the core can crunch through instructions.
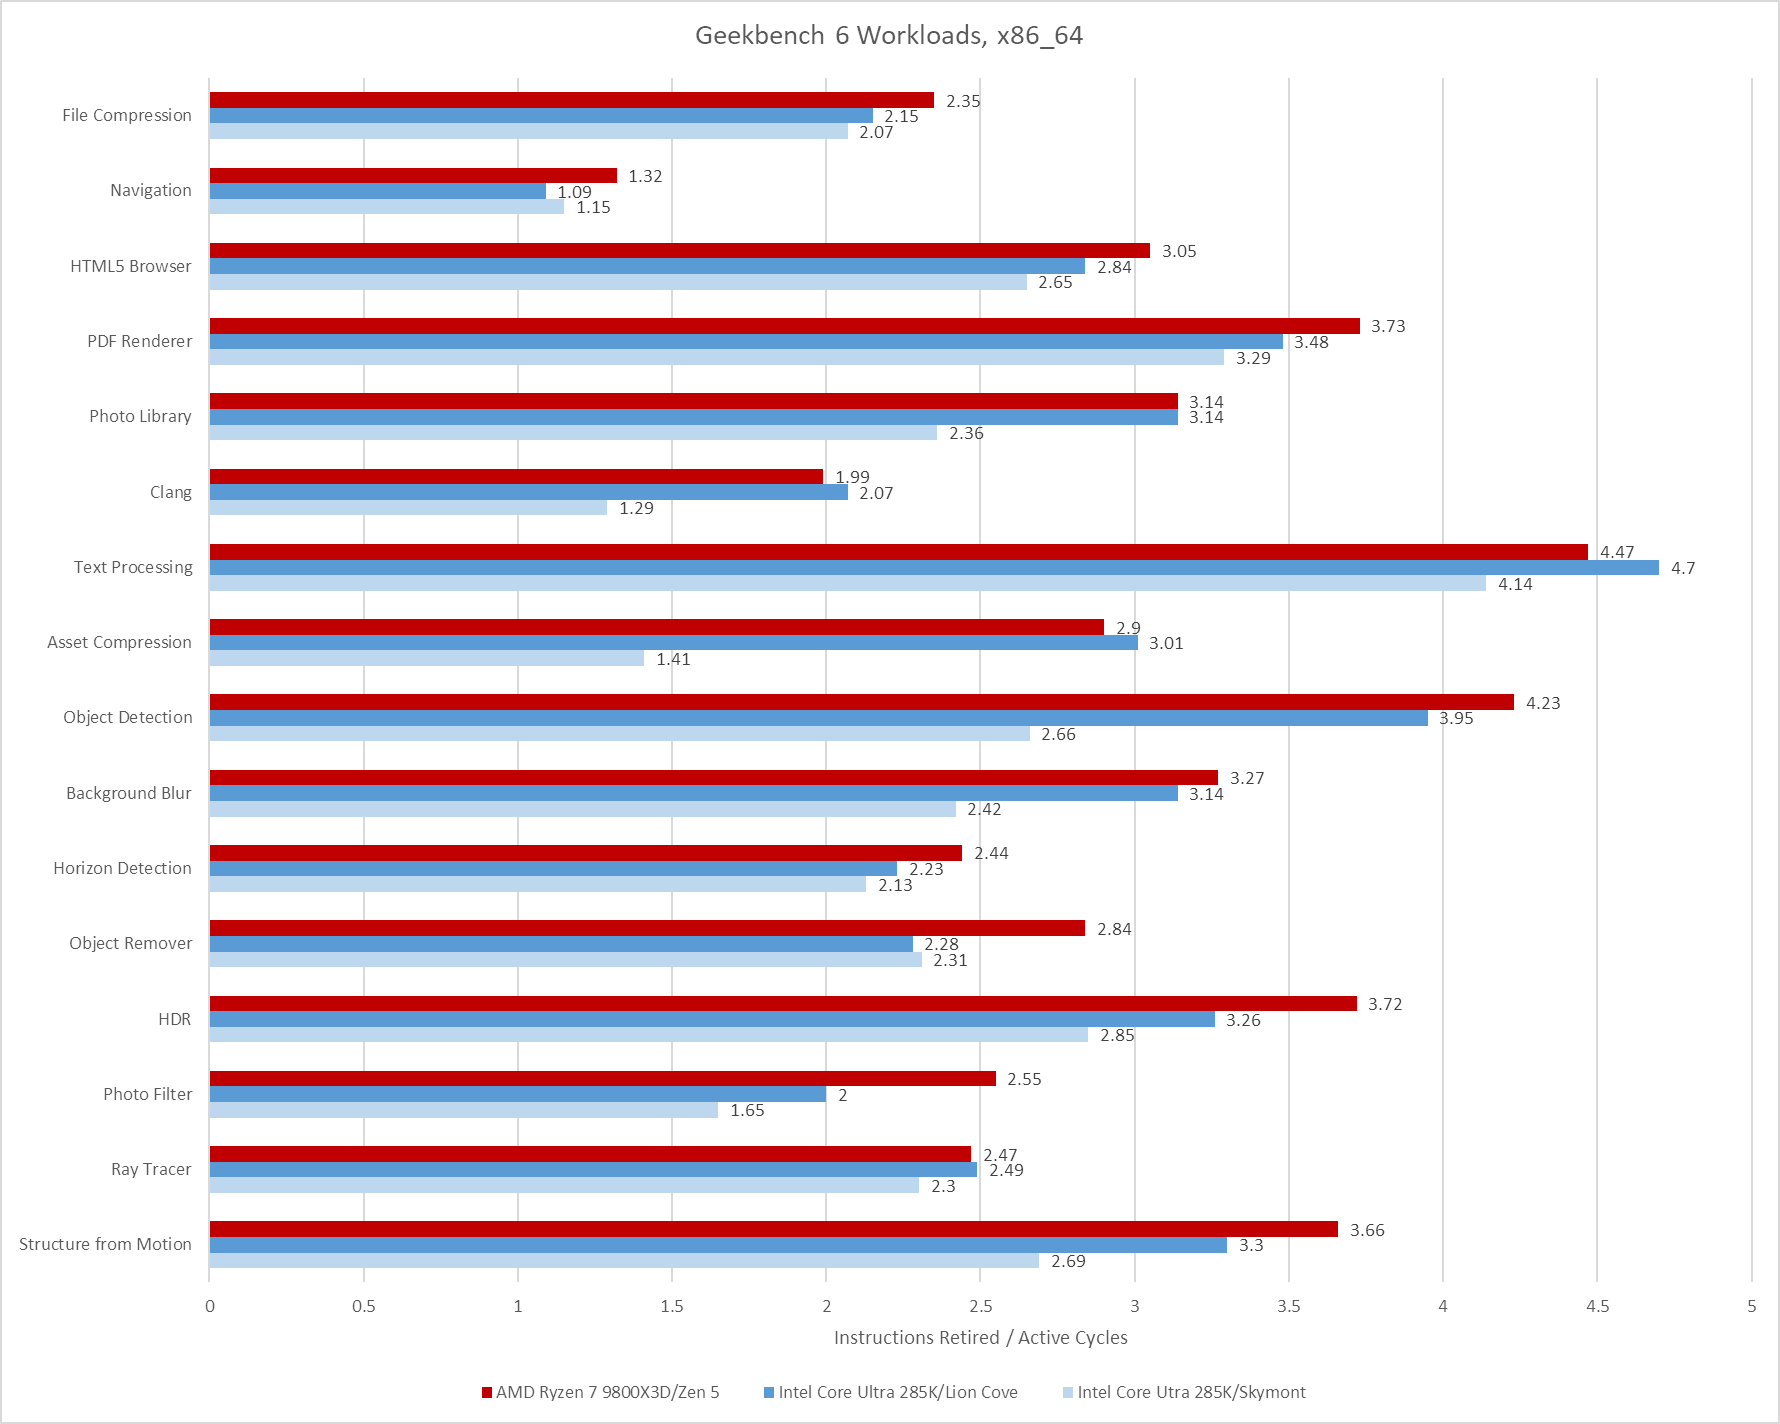
Geekbench 6’s IPC distribution is skewed towards the medium to medium-high IPC range. Many workloads average well beyond 2 IPC on high performance cores like Intel’s Lion Cove and AMD’s Zen 5. Skymont isn’t explicitly a high performance core, but can often get close in IPC terms. However, it’s more prone to “glass jaw” cases, as can be seen in Clang, Asset Compression, Photo Library, and Structure From Motion.
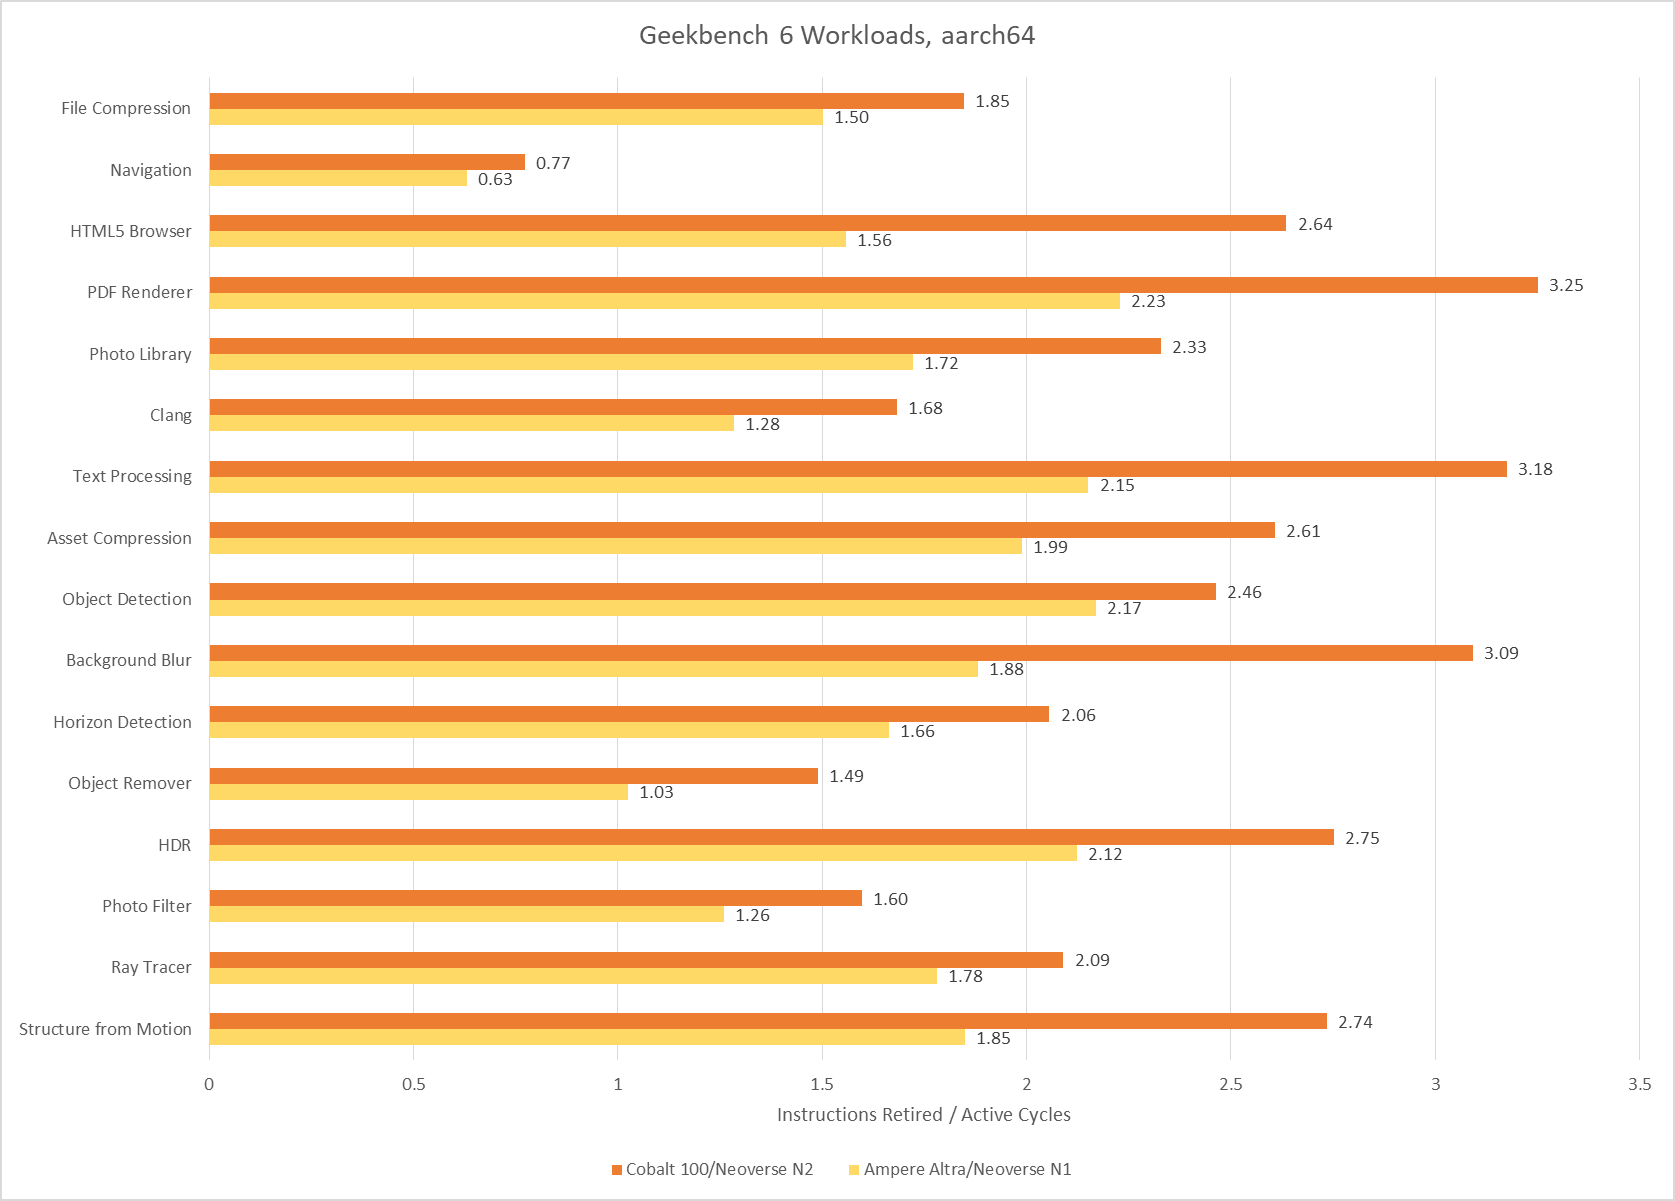
Poking around with a couple of aarch64 cores tells much the same story. Arm’s Neoverse N1 and Neoverse N2 achieve reasonably good throughput considering their likely design targets. I consider anything above 2 IPC to be high for a 4-wide core, and Neoverse N1 hits plenty of those cases. Neoverse N2 is a 5-wide core ,and sails past 3 IPC on several tests. Neoverse N1 does end up with somewhat low IPC on Object Remover, but I suspect that’s down to a weaker vector execution setup. Only Navigation sticks out as a persistently difficult, low IPC workload across all the CPUs I tested.
SPEC CPU2017 shows a wider IPC distribution, with more difficult low IPC workloads. That’s especially the case for SPEC’s integer suite, where 505.mcf and 520.omnetpp pose huge challenges even for sophisticated, high performance cores.
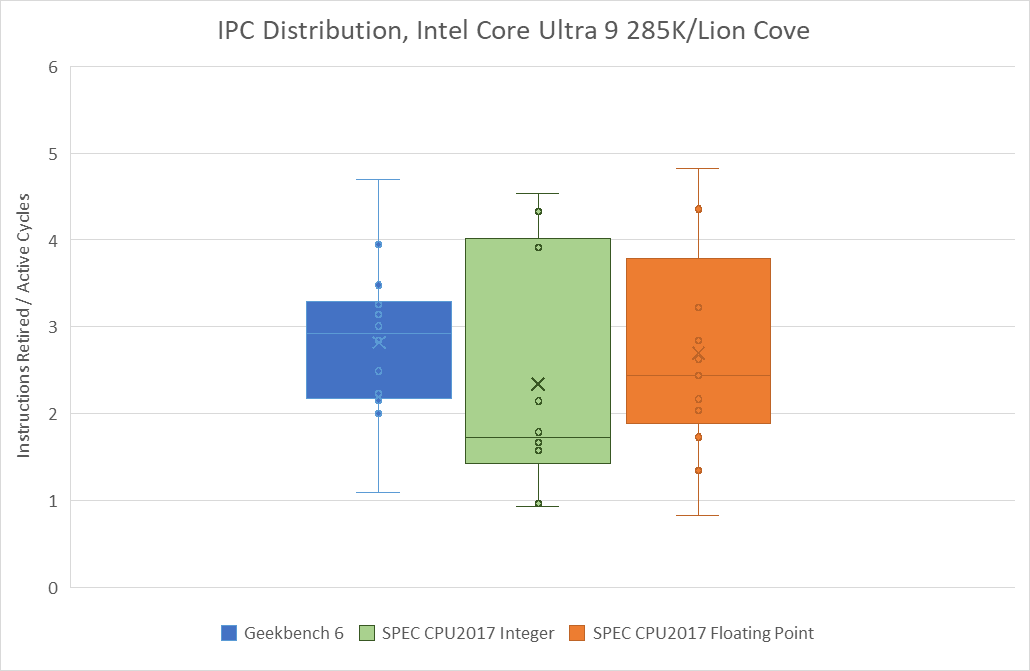
Geekbench 6’s IPC distribution lands closer to that of SPEC’s floating point suite, though SPEC still shows more IPC variation. 549.fotonik3d is a very low IPC outlier, and represents a corner case bound by how much bandwidth a single core can pull from DRAM. In general, Geekbench 6 has a much tighter IPC distribution across its workloads than SPEC does.
Branch Prediction
Branch prediction is both difficult and vital to high performance. Modern cores devote enormous resources to branch prediction. Geekbench 6 has several workloads that challenge branch predictors even on modern cores.
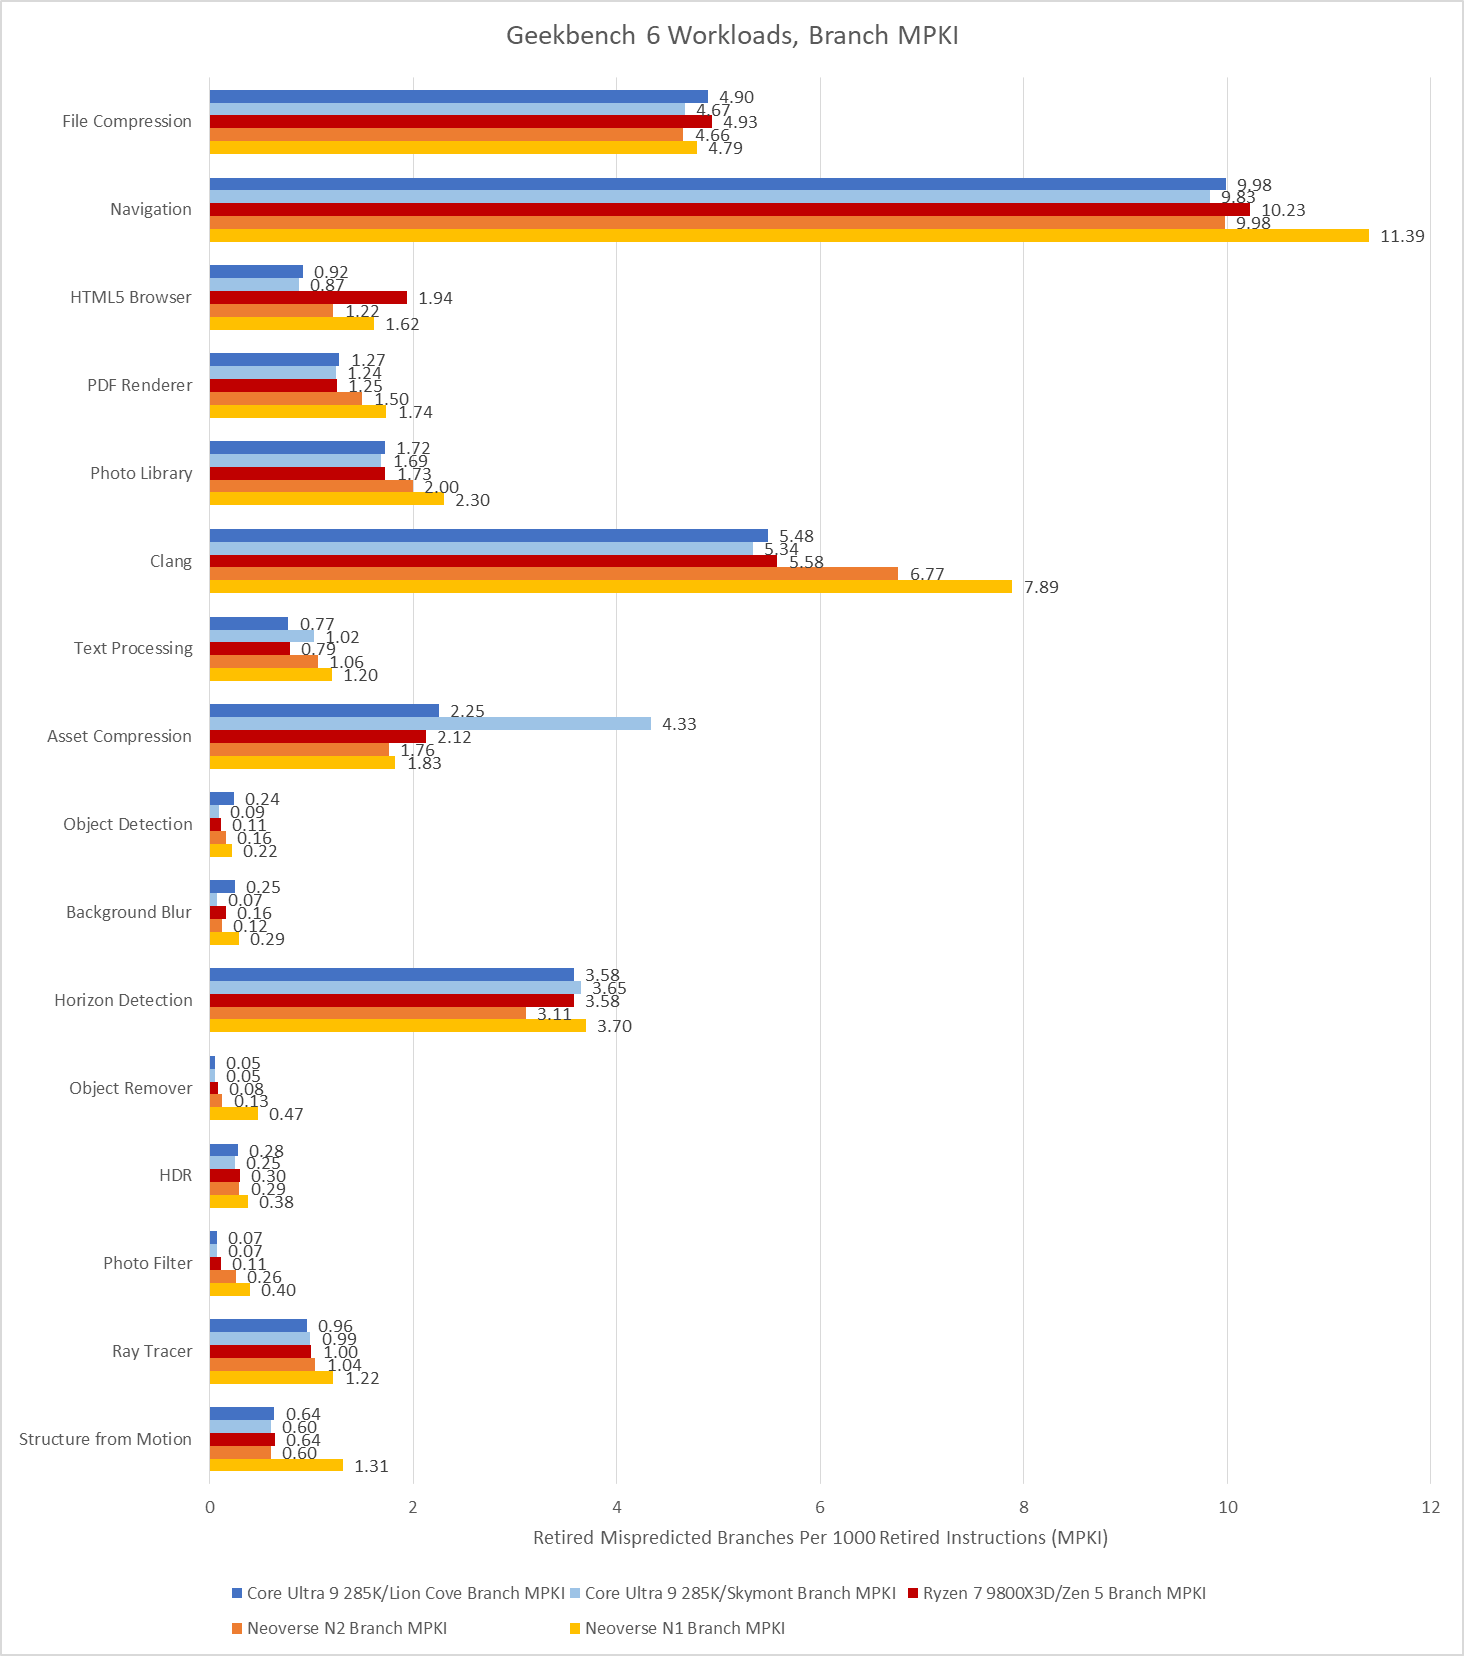
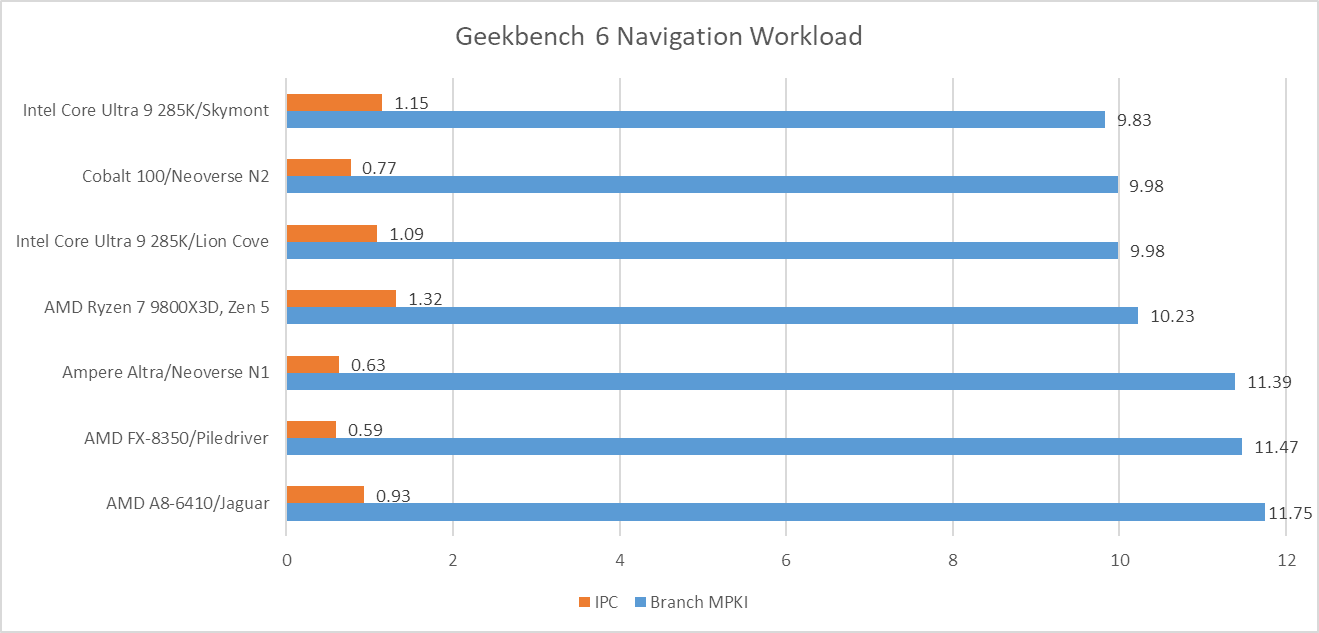
Navigation is by far the worst, with a high enough MPKI figure that mispredicts are likely the single biggest reason behind its low IPC. More advanced predictors help, but don’t solve the problem. That creates a curious situation where newer cores see little IPC improvement compared to older, smaller ones from over a decade ago.
Aside from Navigation, File Compression and Clang present moderate challenges for branch predictors. Newer predictors tend to help in Clang, while older ones tend to get shredded.
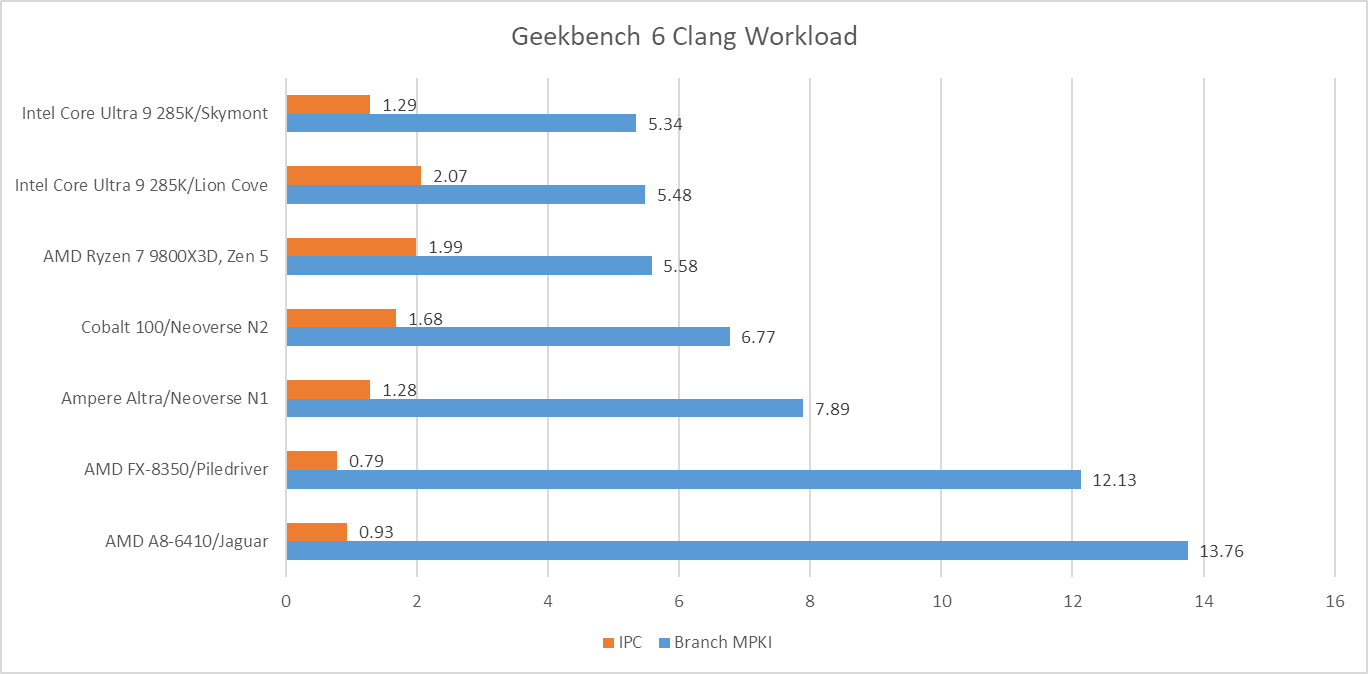
Asset Compression is an interesting case, because branch prediction normally isn’t a problem in that workload. MPKI is well under control on Lion Cove, Zen 5, and both Neoverse cores. Even much older predictors with less storage budget and less advanced prediction techniques do reasonably well. Piledriver gets away with 2.76 MPKI, while Jaguar is just a tad worse at 2.96 MPKI. However, Skymont’s normally competent predictor trips over itself in this workload suffering 4.33 branch MPKI.
Op Cache Coverage
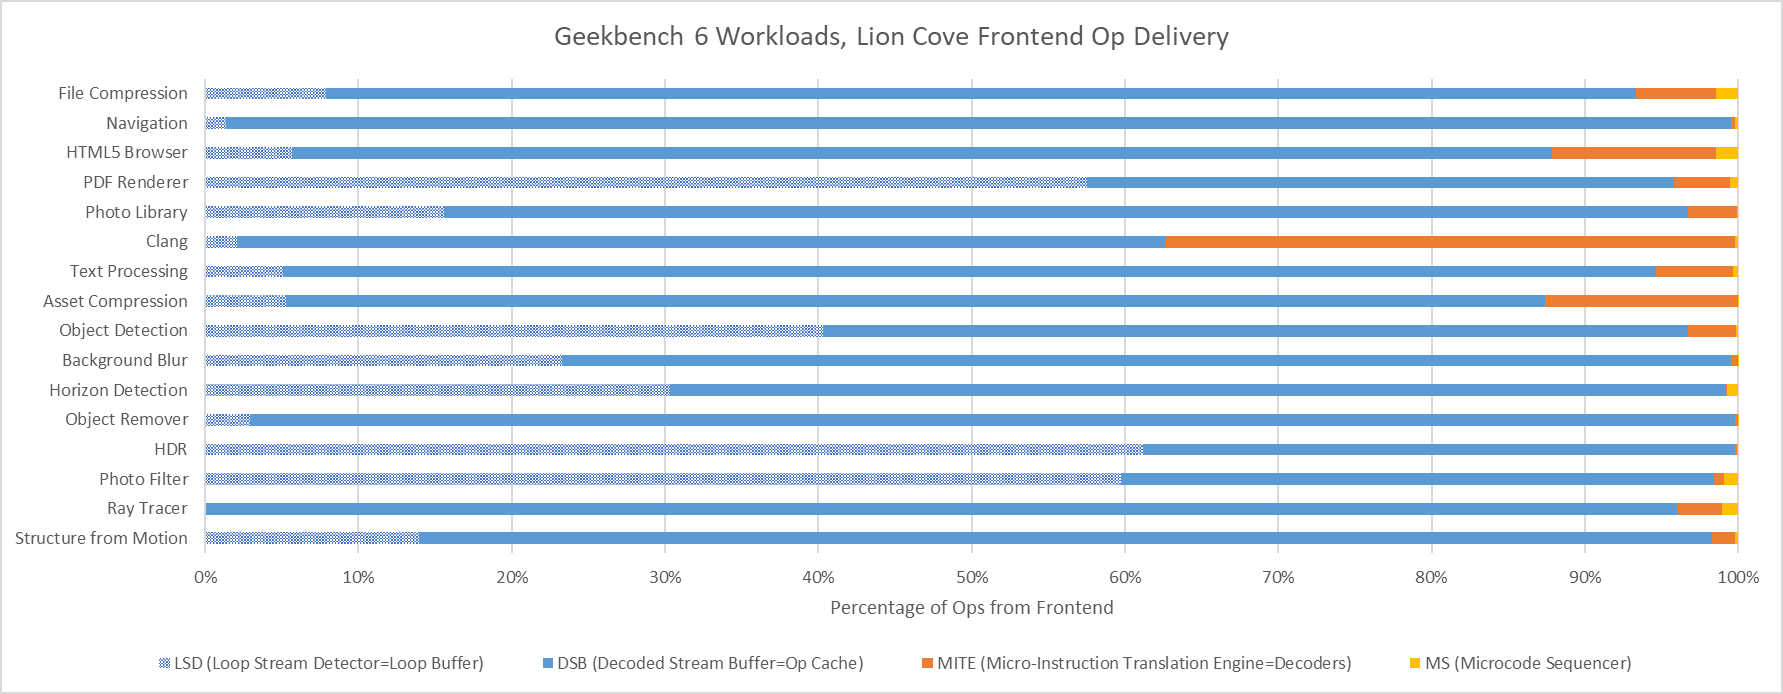
Cache misses can be another major challenge for modern CPUs. On the instruction side, only Clang has a large enough code footprint to spill out of Lion Cove’s 5.2k entry op cache. On the other end of the spectrum, several Geekbench 6 workloads appear to spend much of their time executing tiny loops. In PDF Renderer, HDR, and Photo Filter, Lion Cove’s frontend is often able to feed the core out of its 192 entry loop buffer. That doesn’t improve core throughput because Lion Cove is still limited by its 8-wide rename and allocate stage downstream, but it does suggest excellent code locality in those workloads. High loop buffer usage can also help save power, because much of the frontend could be turned off when running code out of the loop buffer.
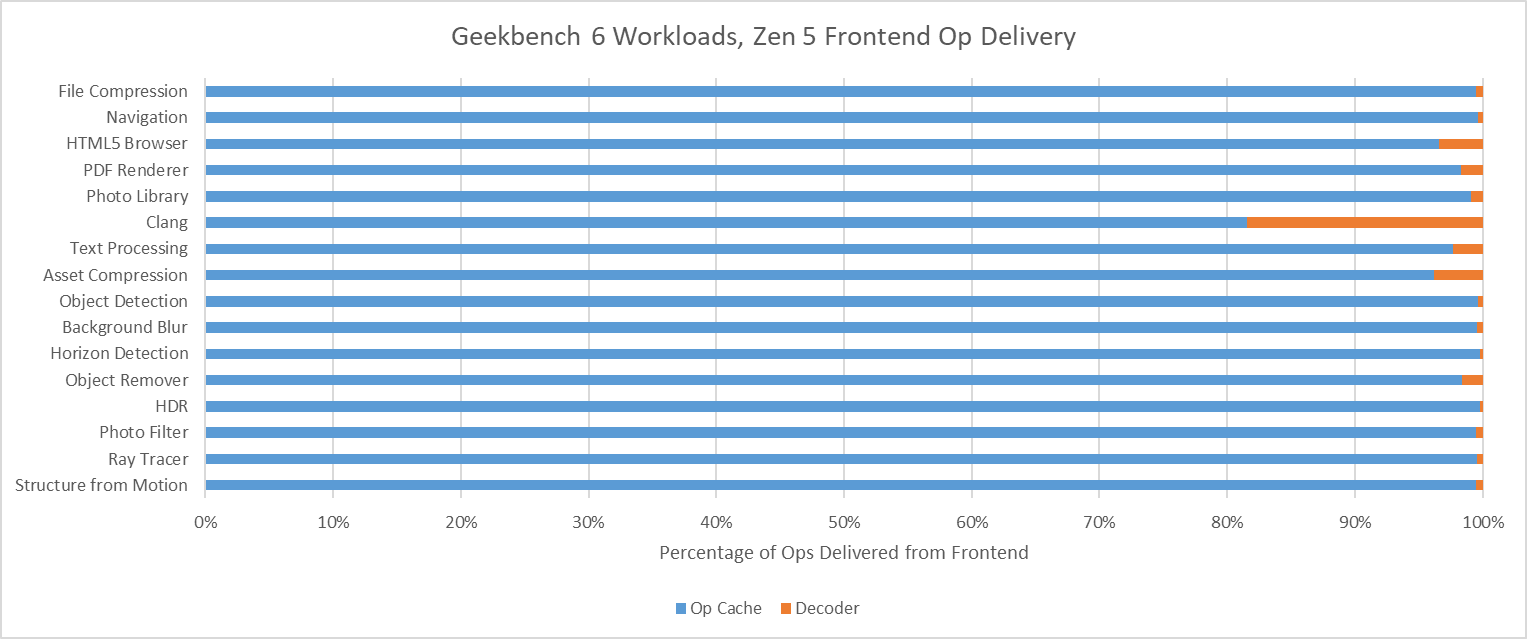
Zen 5 has an even larger op cache with 6K entries, and a well optimized one at that. Again, Clang is the only workload that offers any significant challenge to the op cache. Even then, Zen 5 can mostly feed itself from the op cache rather than the decoders. That’s very much where AMD wants to be, since Zen 5’s decoder setup is weaker than Lion Cove’s when running a single thread.
Data Access
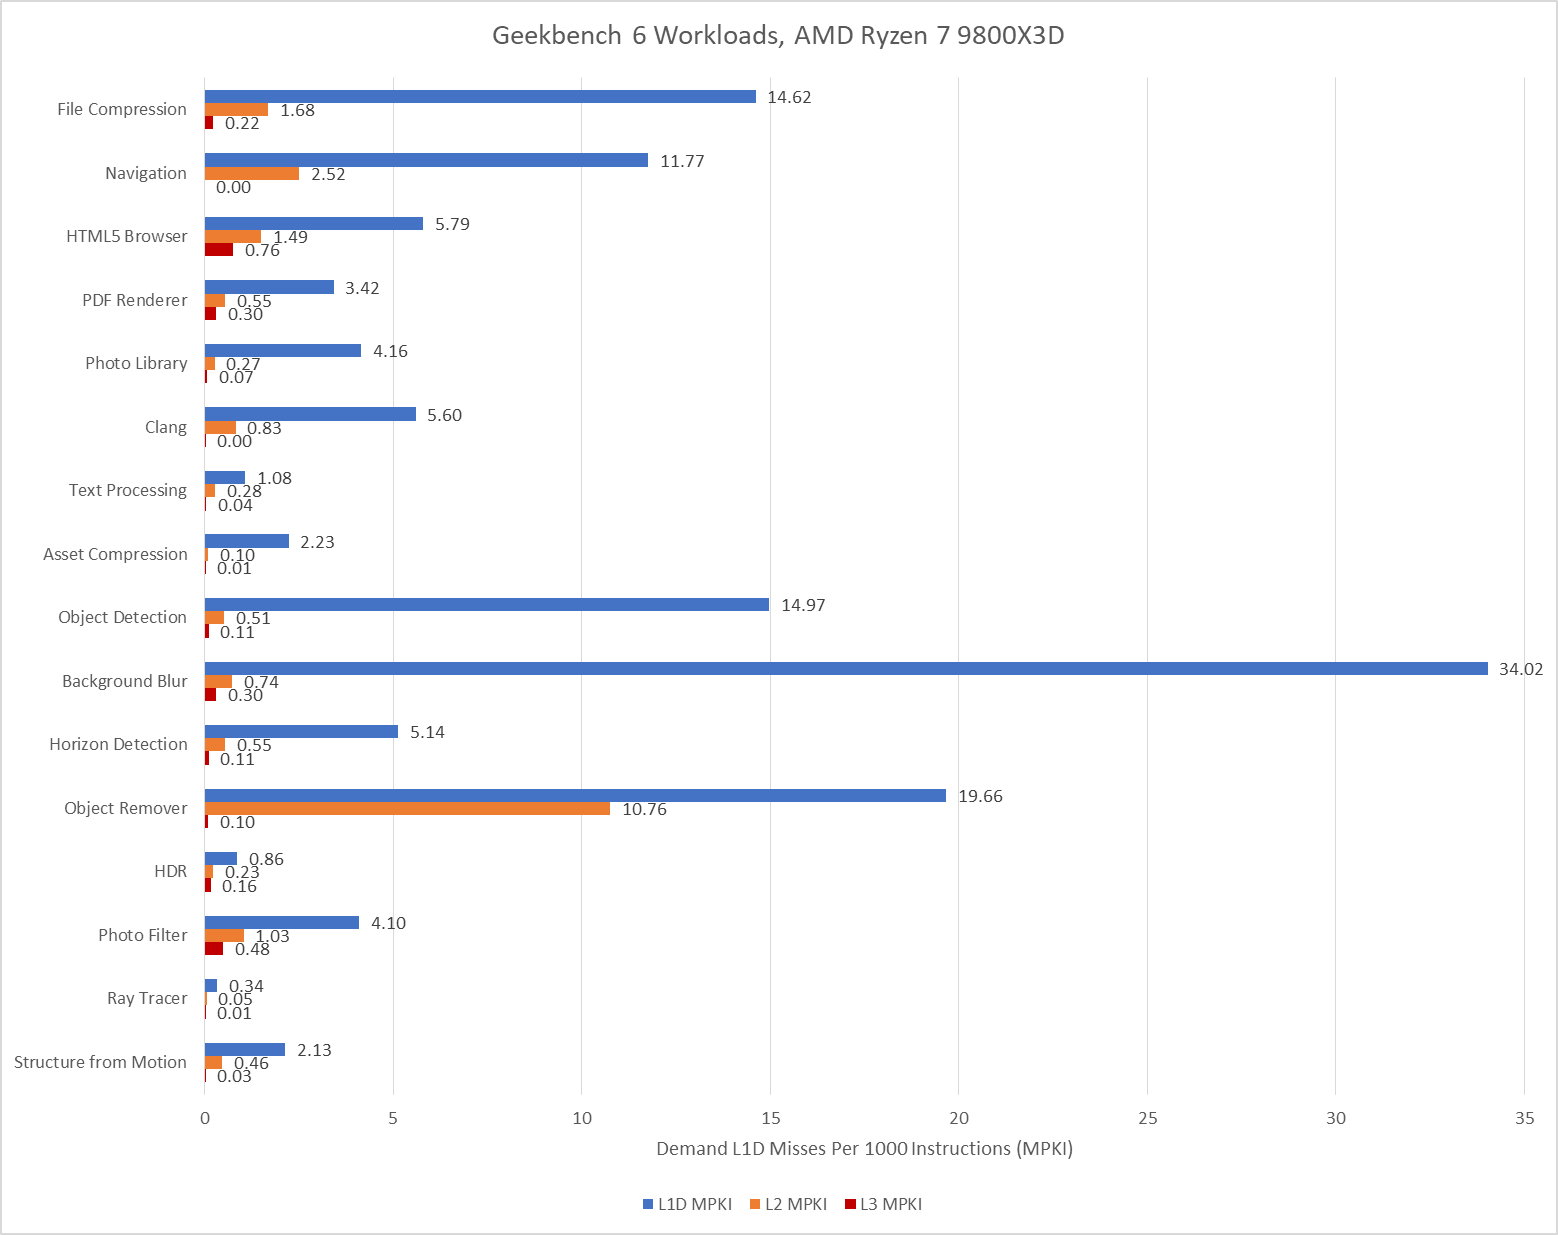
Data-side memory accesses tend to have more challenging patterns. Many of Geekbench 6’s workloads create heavy L1D miss traffic on Lion Cove. Most of these L1D misses are caught at L2. Lion Cove’s large 3 MB L2 pulls a lot of weight in making sure the core can sustain high IPC across much of Geekbench 6’s suite, despite high L3 latency. The new 192 KB L1.5D cache does well to, and occasionally captures the vast majority of L1D misses. Object Remover stands out as the only test with very high L2 miss traffic on Lion Cove.
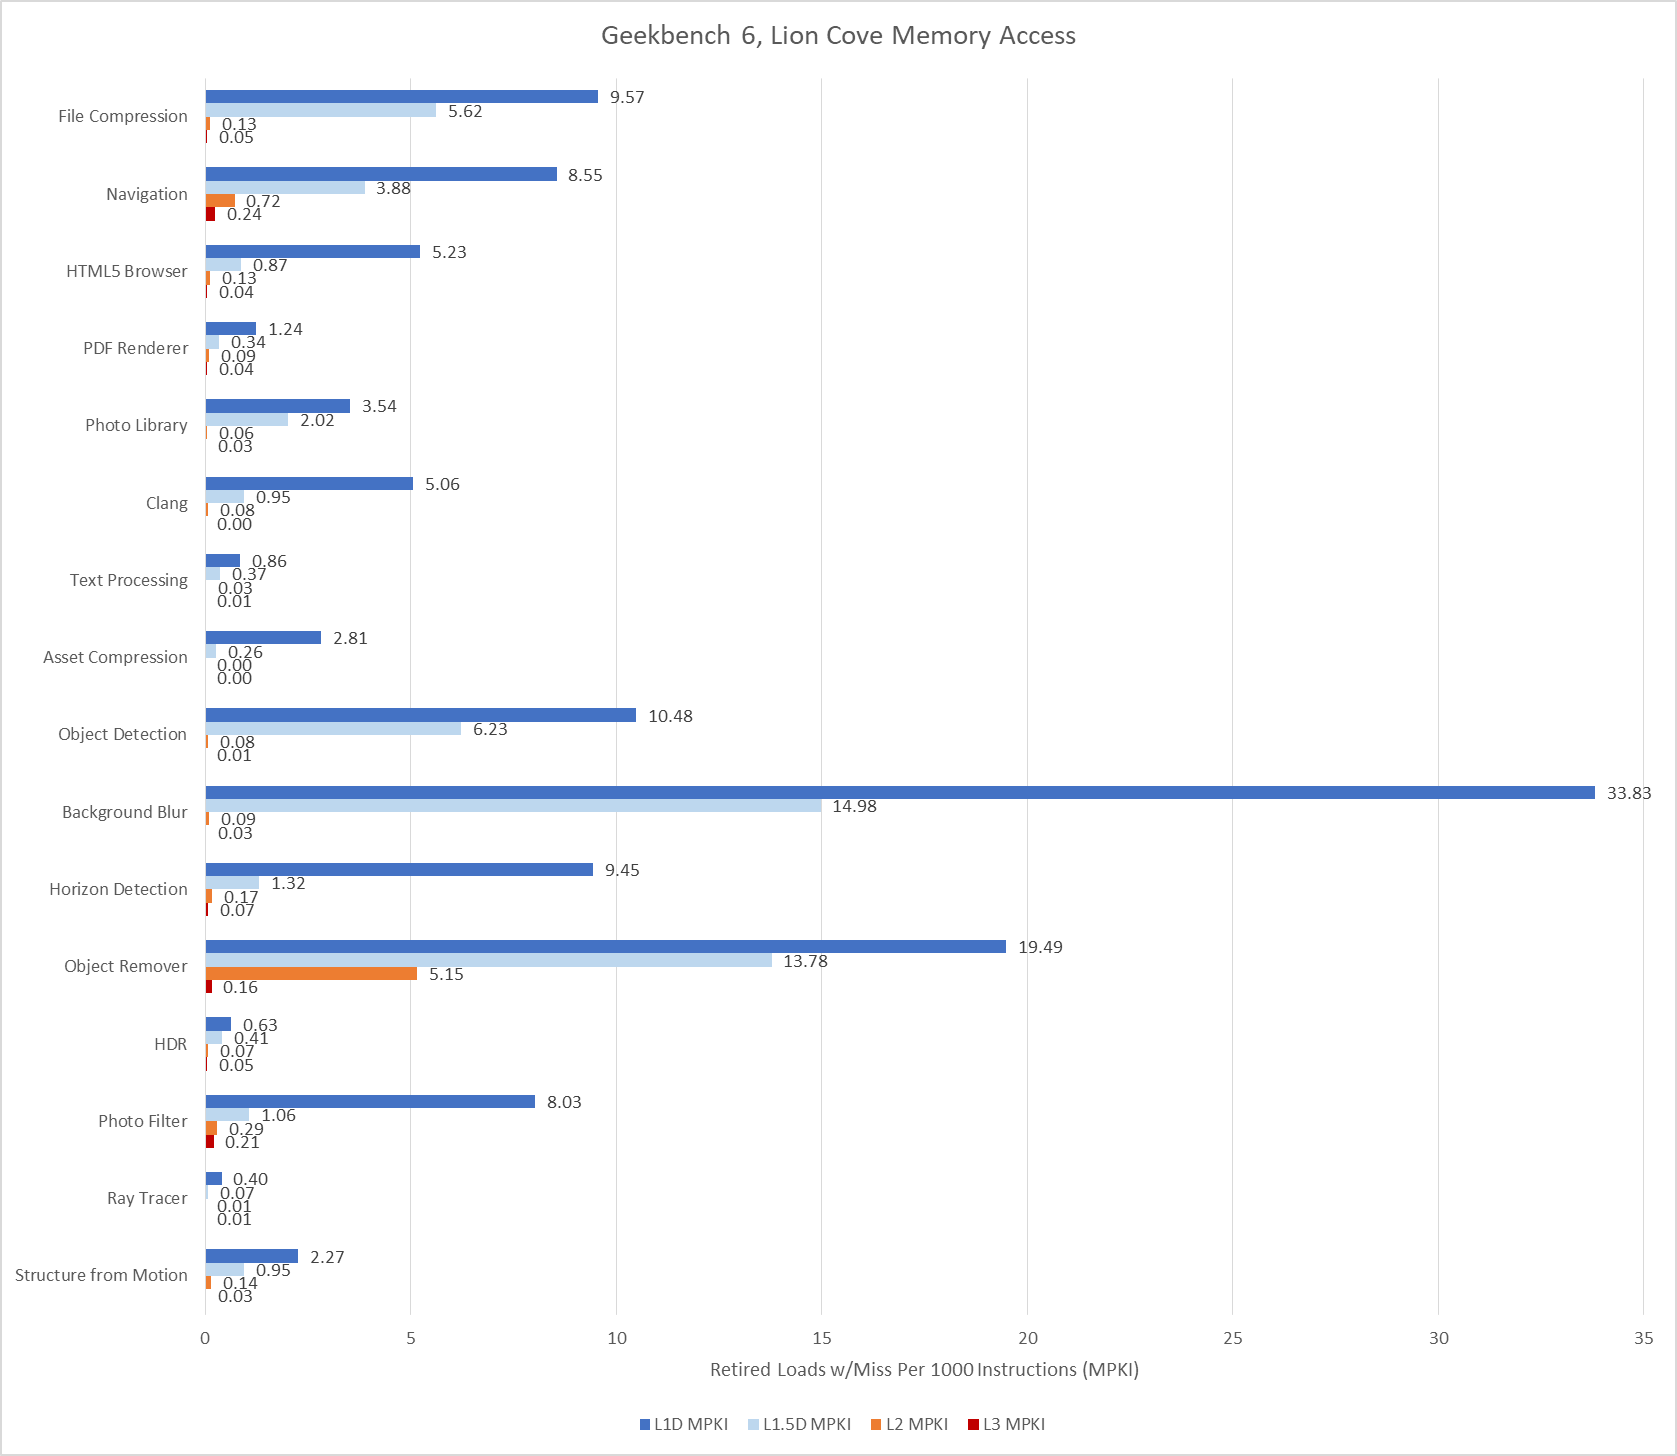
L3 misses tend to be low, hinting at good data locality or predictable access patterns. Performance counters here specifically count the first retired load that created a miss to a 64B line. If a load requests data from a cache line that already has a miss request in progress, initiated either by a previous load or a prefetch, that counts as a FB (fill buffer) hit. I didn’t log that here. However, I did track traffic right in front of the CPU tile’s die-to-die interface, at what Intel calls the arbitration queue. I’m using that as a proxy for CPU-side L3 miss and DRAM bandwidth.
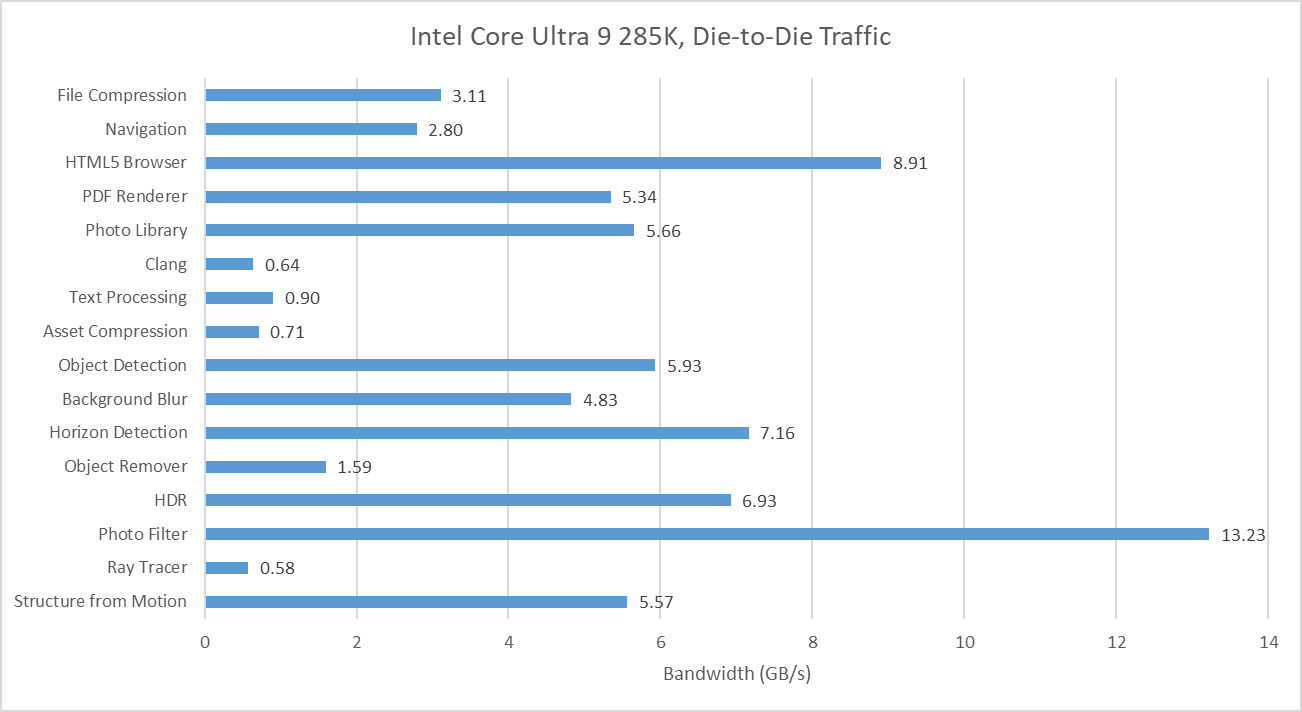
Many of Geekbench 6’s workloads request multiple gigabytes per second across the die-to-die interface, though none push the memory subsystem from a single thread as hard as SPEC CPU2017’s fotonik3d. Photo Filter is the most bandwidth heavy test in Geekbench 6, despite having a tame-looking 0.23 L3 MPKI figure. That suggests Lion Cove’s prefetcher is able to initiate many memory requests before an instruction asks for the data. Prefetching helps mitigate DRAM latency and keep IPC up. That low MPKI figure contrasts with behavior in games, which tend to miss L3 and can be sensitive to DRAM latency.
AMD’s performance events count demand data cache refills, rather than tagging loads with data sources and counting at retirement. Demand means a refill initiated by an instruction, as opposed to the prefetcher. They’ll generally give higher counts compared to events at retirement, especially if a lot of instructions execute but are later flushed (for example from branch mispredicts).
With 96 MB of L3, the Ryzen 7 9800X3D practically eliminates L3 misses for the Navigation workload and improves in Object Remover too. Elsewhere, the difference in where events are counted and the low L3 miss activity overall makes it hard to tell if the larger cache helps compared to the 36 MB L3 in Arrow Lake. Further up in the memory subsystem, Zen 5’s smaller 1 MB L2 can still be very effective, but often suffers more misses than Lion Cove’s larger L2. AMD has to rely a little more on their L3, which does have better performance than Intel’s.
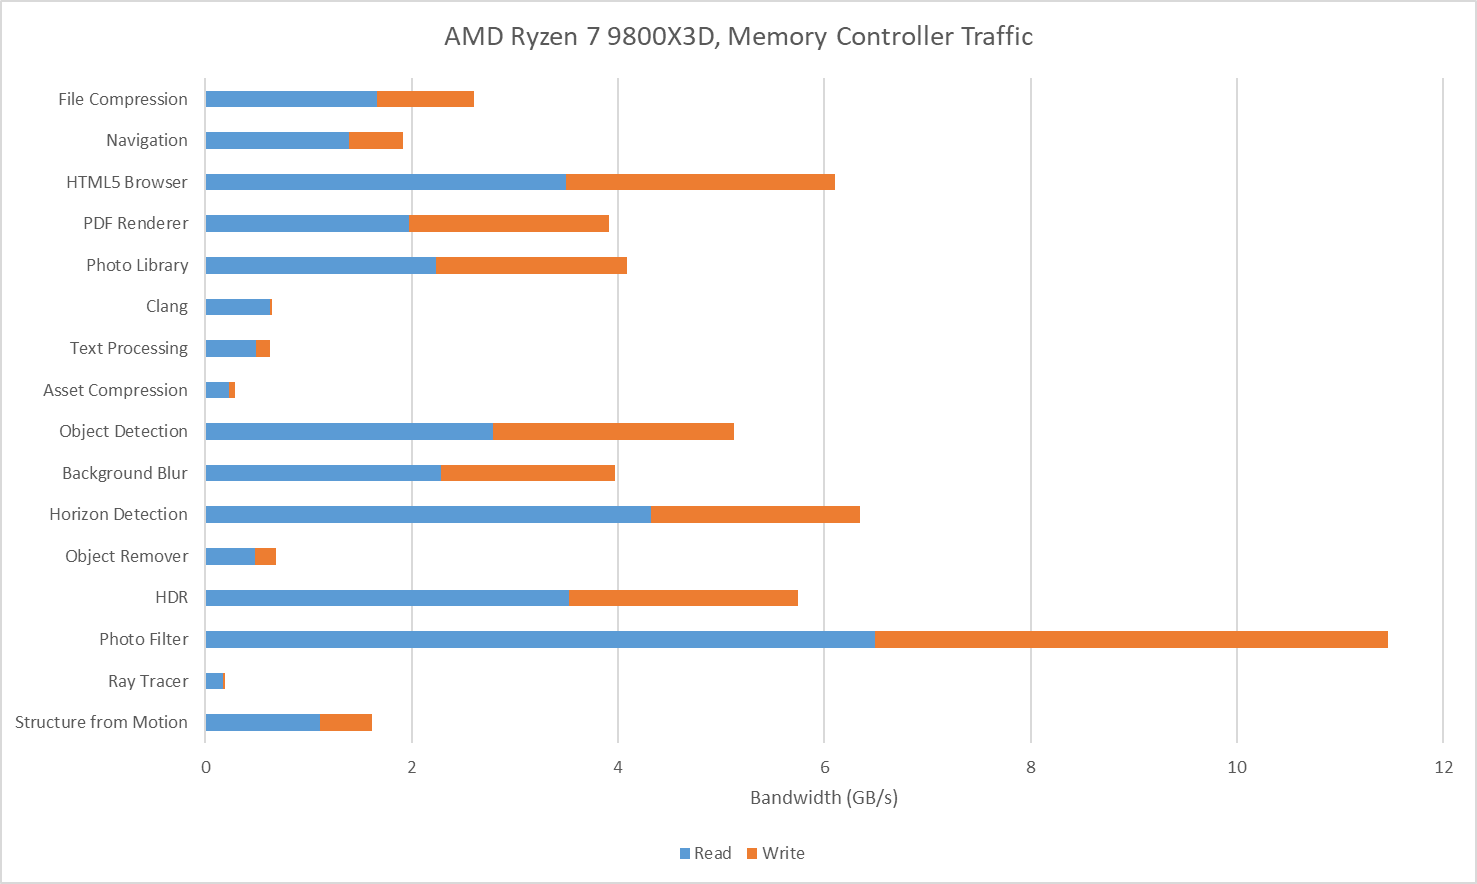
I also tracked traffic at the Ryzen 7 9800X3D’s memory controllers. I tried to gather data at the IO die side of the die-to-die interface (CCMs), but couldn’t get Data Fabric performance events figured out for write traffic. Unified Memory Controller (UMC) data should be adequate anyway because I have the iGPU disabled and should have very little IO traffic while running Geekbench 6 workloads. The Ryzen 7 9800X3D overall has lower DRAM traffic than on the 285K, likely thanks to the former’s larger L3. Generally though, the pattern is similar. Photo Filter stands out as a bandwidth heavy but prefetch friendly workload. HTML5 Browser and Horizon Detection slot into the same category.
Score Calculation
Both Geekbench 6 and SPEC CPU2017 scores are given in speedup relative to a reference system. Geekbench 6’s reference system is a Dell Precision 3460 with a Core i7-12700, which is set to a baseline score of 2500. SPEC CPU2017’s reference system is a Sun Fire V490 with 2.1 GHz UltraSPARC-IV+ processors, which is set to a score of 1.
I find SPEC CPU2017’s score easier to interpret because it’s simply a speedup ratio, while Geekbench 6’s score takes a bit more math to get there. On the flip side, Geekbench 6’s reference system is more modern and relevant. The Sun Fire V490 dates back to 2009, and already performed poorly compared to systems from just a few years later. A Sandy Bridge or Bulldozer system would provide a far better reference point.
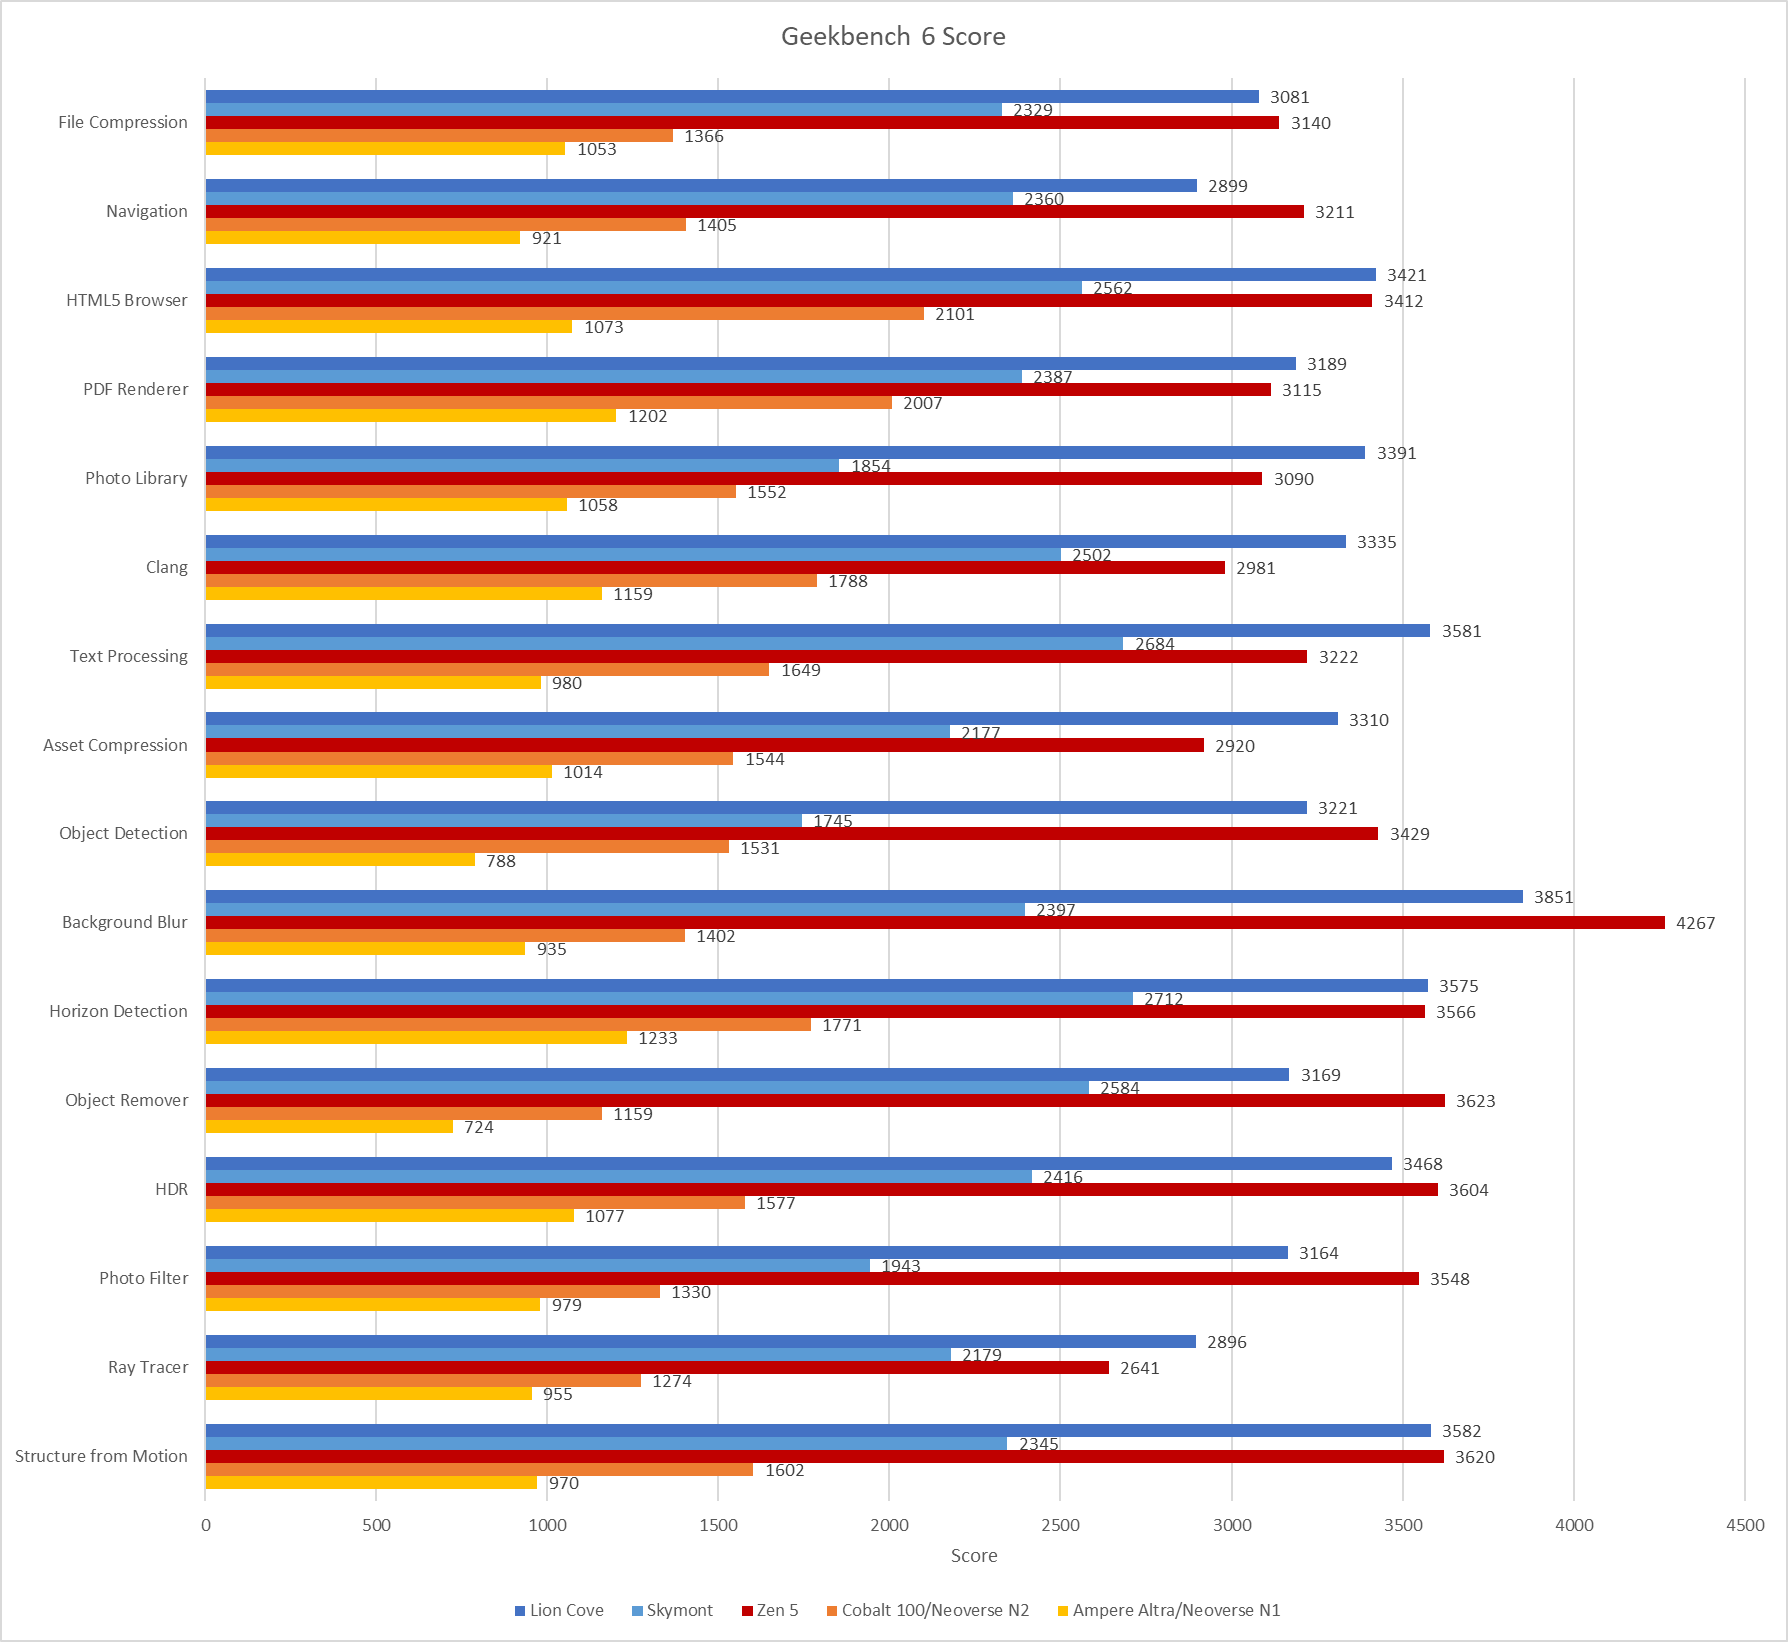
Geekbench 6’s reference system also has strong vector execution capabilities, assuming the workloads mostly ran on the 12700’s P-Cores. Geekbench 6’s workloads tend to be vector heavy, so the baseline sets rather demanding expectations. Skymont has weak vector execution despite improving on prior E-Cores, and often falls below the 2500 score baseline. The same applies to Arm’s Neoverse N1 and N2, though those cores also fall behind because they’re optimized for lower performance targets in general.
Final Words
Geekbench 6 is a vector-heavy suite that emphasizes core throughput. Many workloads have small instruction footprints, enjoy good branch prediction accuracy, and are prefetcher friendly. There are exceptions of course. Navigation stands out as one of the only low IPC workloads, bound by branch mispredicts. Clang does run into some op cache misses, though the larger op cache on Zen 5 still does very well, and other factors seem to hold back its IPC before Zen 5’s per-thread, 4-wide decoders present a limitation.
SPEC CPU2017 shows some of the same characteristics, with a large number of workloads that don’t pressure the memory subsystem as much as games do. While SPEC captures a broader range of IPC-related challenges, its emphasis on portability means it doesn’t stress vector execution as much as Geekbench 6 can. Both suites ultimately serve different purposes, and neither can be used in place of the other. Going forward, I expect both SPEC and Primate Labs to continue evaluating application behavior, and update their workloads as typical application behavior evolves.
I think SPEC2026 came out two days ago.
https://www.spec.org/cpu2026/
The "Object Detection" test makes heavy use of VNNI. On Skylake it gets about 3-4x slower than Rocket Lake, and also is slower than A76.
The "Photo Filter" test is also the same, but the slowdown is slightly less.
Is there any way to actually test this out? This is just my guess.