Disabling Zen 5’s Op Cache and Exploring its Clustered Decoder
Zen 5 has an interesting frontend setup with a pair of fetch and decode clusters. Each cluster serves one of the core’s two SMT threads. That creates parallels to AMD’s Steamroller architecture from the pre-Zen days. Zen 5 and Steamroller can both decode up to eight instructions per cycle with two threads active, or up to four per cycle for a single thread.
Despite these decoder layout similarities, Zen 5’s frontend operates nothing like Steamroller. That’s because Zen 5 mostly feeds itself off a 6K entry op cache, which is often large enough to cover the vast majority of the instruction stream. Steamroller used its decoders for everything, but Zen 5’s decoders are only occasionally activated when there’s an op cache miss. Normally that’d make it hard to evaluate the strength of Zen 5’s decoders, which is a pity because I’m curious about how a clustered decoder could feed a modern high performance core.
Thankfully, Zen 5’s op cache can be turned off by setting bit 5 in MSR 0xC0011021. Setting that bit forces the decoders to handle everything. Of course, testing with the op cache off is completely irrelevant to Zen 5’s real world performance. And if AMD wanted to completely serve the core using the decoders, there’s a good chance they would have gone with a conventional 8-wide setup like Intel’s Lion Cove or Qualcomm’s Oryon. Still, this is a cool chance to see just how Zen 5 can do with just a 2×4-wide frontend.
Here, I’m testing Zen 5 using the AMD Ryzen 9 9900X, which implements 12 Zen 5 cores in two 6-core clusters. I did an in-socket swap from my Ryzen 9 7950X3D, which means the 9900X is fed off the same DDR5-5600 setup I had from 2023. Performance results won’t be directly comparable to Ryzen 9 9950X figures from a prior article, because the 9950X had faster DDR5-6000.
Microbenchmarking Instruction-Side Bandwidth
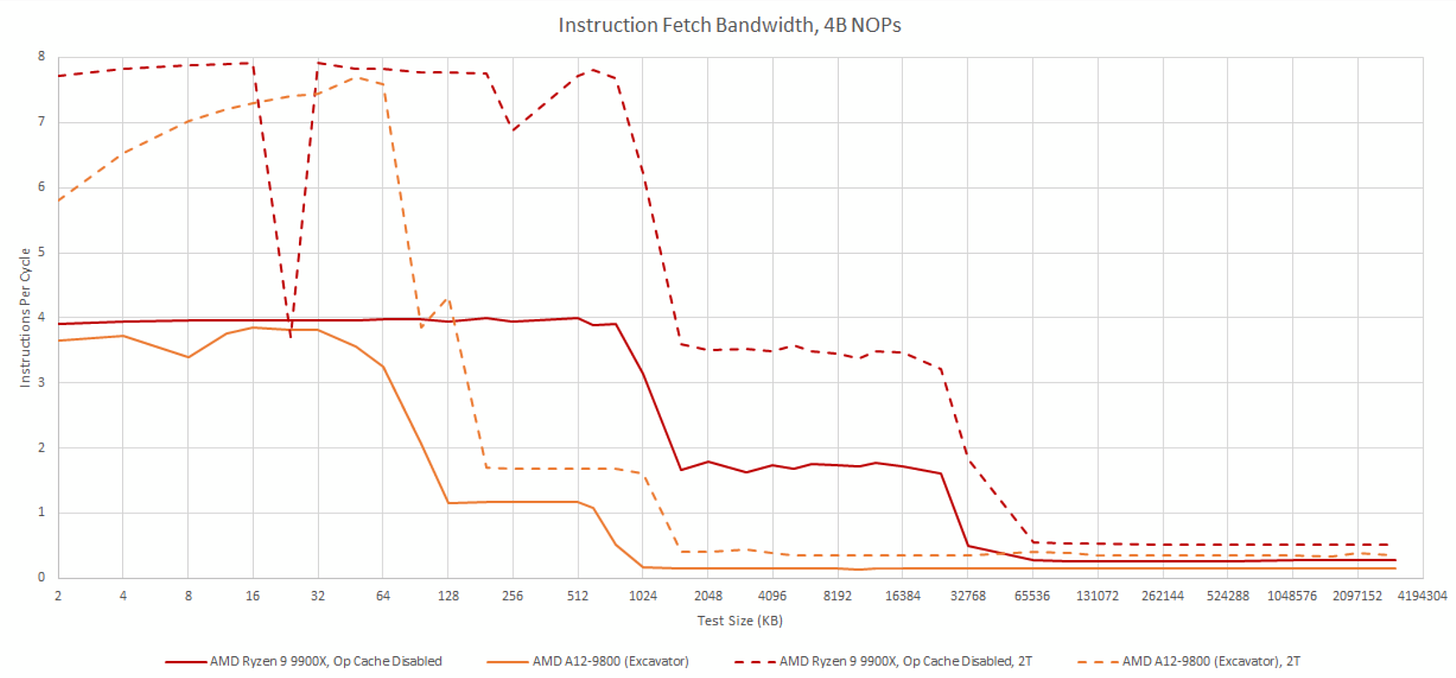
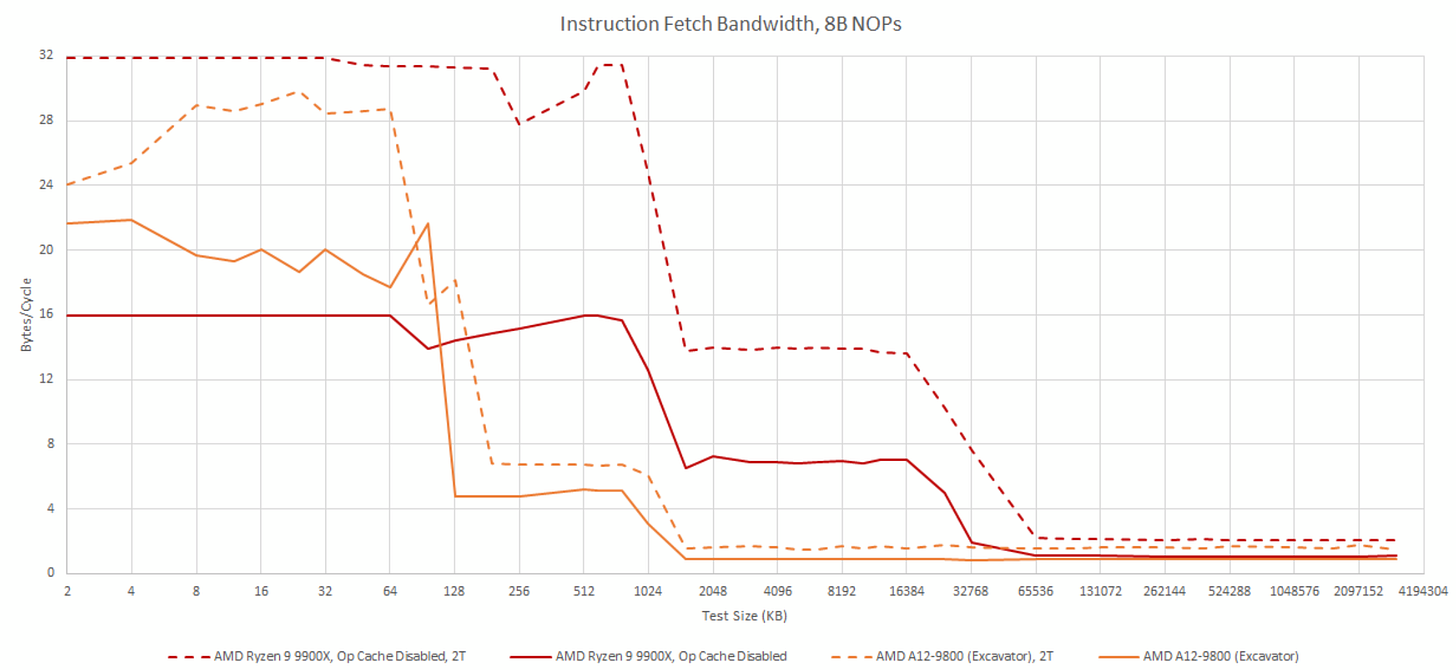
To get a handle on how the frontend behaves in pure decoder mode, I fill an array with NOPs (instructions that do nothing) and jump to it. AMD’s fetch/decode path can handle 16 bytes per thread cycle in this test. AMD’s slides imply each fetch/decode pipe has a 32B/cycle path to the instruction cache, but I wasn’t able to achieve that when testing with 8 byte NOPs. Maybe there’s another pattern that achieves higher instruction bandwidth, but I’m mostly doing this as a sanity check to ensure the op cache isn’t in play.
Shorter 4 byte NOPs are more representative of typical instruction length, and stress decoder throughput rather than instruction cache bandwidth. Turning off the op cache limits a single thread to 4 IPC, as expected. Running two threads in the core, and thus using both decode clusters, brings total throughput to 8 IPC.
Across both patterns, Zen 5’s dual fetch pipes provide a huge increase in L1i miss bandwidth. Likely, each fetch pipe maintains an independent queue of L1i miss requests, allowing increased memory level parallelism with both threads active.
Steamroller/Excavator Parallels?
AMD’s Excavator architecture is an iterative improvement over Steamroller, and carries forward Steamroller’s clustered decode scheme. Excavator behaves much like Zen 5 as long as code fits within the instruction cache. But if the test spills out of L1i, Zen 5 behaves far better. Where Excavator has a single L1i fetch path feeding two decode clusters, Zen 5 duplicates the fetch paths too. That’s another key difference between Zen 5 and Steamroller/Excavator, besides Zen 5 having an op cache.
With 8-byte NOPs though, Excavator can surprisingly give more L1i bandwidth to a single thread. That advantage goes away when both decoders pile onto the single fetch path, after which both Zen 5 and Excavator appear capped at 32 bytes per cycle.
Excavator does enjoy slightly better L2 code bandwidth when both threads are loaded, but the bandwidth increase is nowhere near the 2x that Zen 5 enjoys. Excavator really wants to avoid fetching code from L2, and has a very large 96 KB instruction cache to avoid that. I’m also amazed that AMD’s old architecture could sustain 8 NOPs/cycle through the module’s pipeline. Special thanks goes to cha0shacker for running tests on his Excavator system.
SPEC CPU2017
SPEC CPU2017 is an industry standard benchmark suite, and is a good way to get a general idea of performance. Disabling the op cache drops Zen 5’s score by 20.3% and 16.8% in the integer and floating point suites, respectively. That’s a substantially heavier penalty than what I saw with Zen 4, where turning off the op cache reduced performance by 11.4% and 6.6% in the integer and floating point suites, respectively. Zen 5 is capable of higher throughput than Zen 4, and feeding a bigger core through a 4-wide decoder is more difficult.
In the previous article, I also found Zen 4 suffered heavier losses from turning off the op cache when both SMT threads were active. Two threads expose more parallelism and enable higher throughput, making the 4-wide decoder even more of a bottleneck. Zen 5’s two decode clusters reverse the situation. Integer and floating point scores drop by 4.9% and 0.82% with the op cache off. For comparison, turning off Zen 4’s op cache leads to heavier 16% and 10.3% drops in the integer and floating point suites.
Zen 5 can reach very high IPC, especially when cache misses are rare and the core’s massive execution engine can be brought to bear. In those workloads, a single 4-wide decode cluster is plainly inadequate. Disabling the op cache in high IPC workloads like 548.exchange2 leads to downright devastating performance losses.
Lower IPC workloads are less affected, but overall penalties are generally heavier on Zen 5 than on Zen 4. For example, turning off Zen 4’s op cache dropped 502.gcc’s score by 6.35%. On Zen 5, doing the same drops the score by 13.7%.
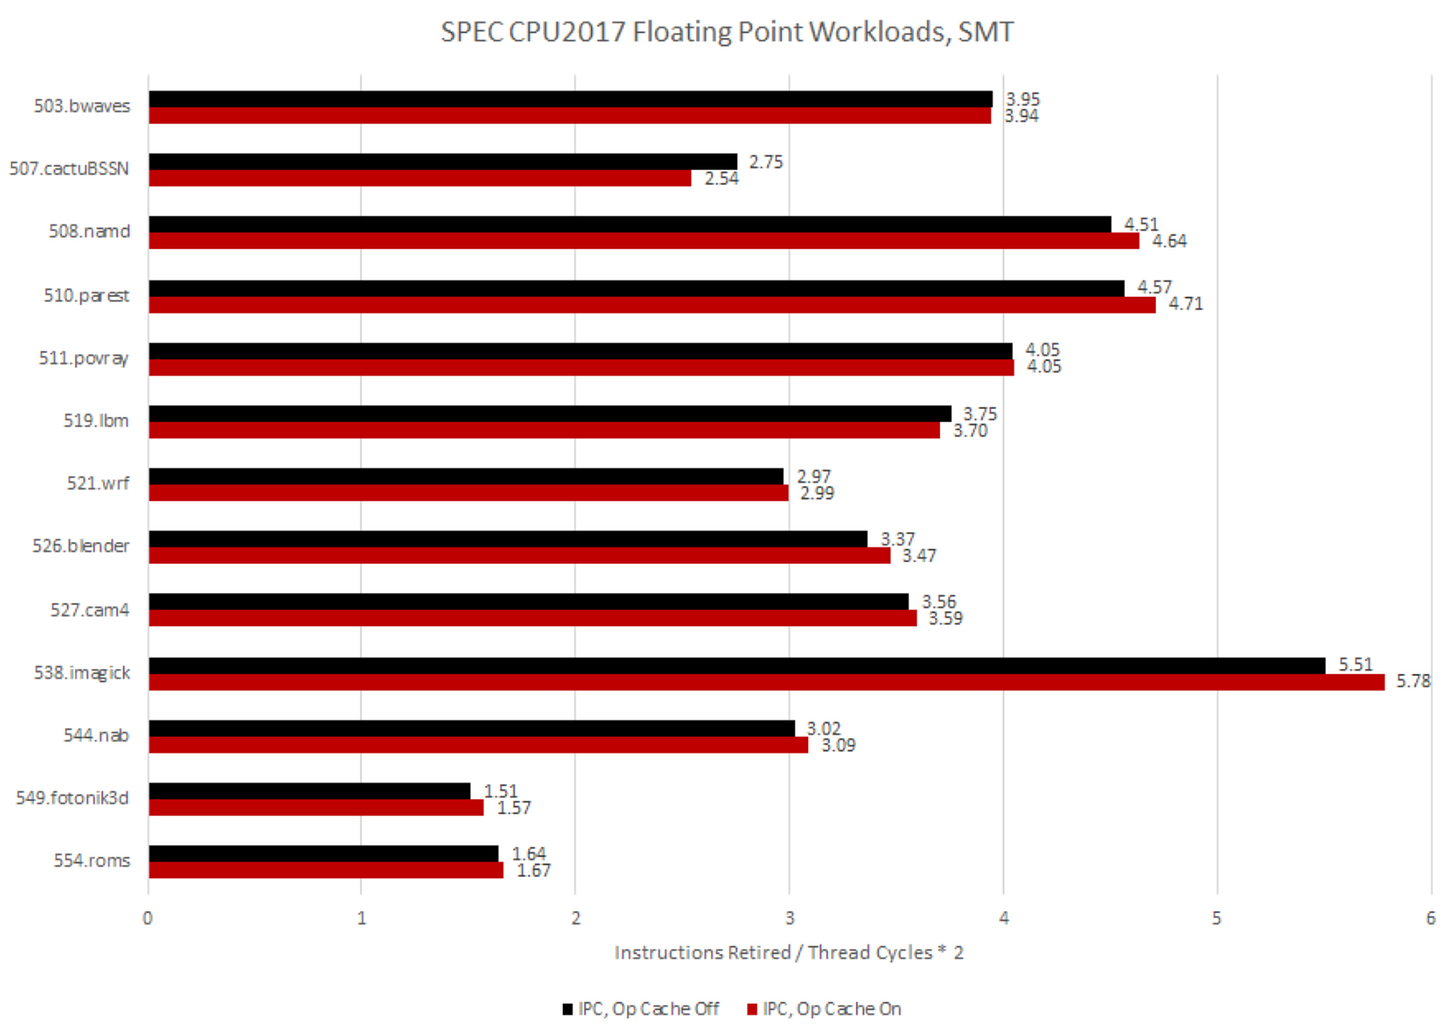
Everything flips around once the second decoder comes into play with SMT. The op cache still often provides an advantage, thanks in part to its overkill bandwidth. Taken branches and alignment penalties can inefficiently use frontend bandwidth, and having extra bandwidth on tap is always handy.

But overall, the dual decode clusters do their job. Even high IPC workloads can be reasonably well fed off the decoders. Performance counters even suggest 525.x264 gains a bit of IPC in decoder-only mode, though that didn’t translate into a score advantage likely due to varying boost clocks.
In SPEC CPU2017’s floating point tests, the dual decoders pull off a surprising win in 507.cactuBSSN. IPC is higher, and SPEC CPU2017 gives it a score win too.
507.cactuBSSN is the only workload across SPEC CPU2017 where the op cache hitrate is below 90%. 75.94% isn’t a low op cache hitrate, but it’s still an outlier.
With both SMT threads active, op cache coverage drops to 61.79%. Two threads will have worse cache locality than a single thread, and thus put more pressure on any cache they have to share. That includes the op cache. Most other tests see minor impact because Zen 5’s op cache is so big that it has little trouble handling even two threads.
In 507.cactuBSSN, the op cache still delivers the majority of micro-ops. But 61.79% coverage likely means op cache misses aren’t a once-in-a-blue-moon event. Likely, the frontend is transitioning between decoder and op cache mode fairly often.
AMD’s Zen 5 optimization guide suggests such transitions come at a cost.
Excessive transitions between instruction cache and Op Cache mode may impact performance negatively. The size of hot code regions should be limited to the capacity of the Op Cache to minimize these transitions
Software Optimization Guide for the AMD Zen 5 Microarchitecture
I’m guessing more frequent op cache/decoder transitions, coupled with IPC not being high enough to benefit from the op cache’s higher bandwidth, combine to put pure-decoder mode ahead.
Besides cactuBSSN’s funny SMT behavior, the rest of SPEC CPU2017’s floating point suite behaves as expected. High IPC workloads like 538.imagick really want the op cache enabled. Lower IPC workloads don’t see a huge difference, though they often still benefit from the op cache. And differences are lower overall with SMT.
From a performance perspective, using dual 4-wide decoders wouldn’t be great as the primary source of instruction delivery for a modern core. It’s great for multithreaded performance, and can even provide advantages in corner cases with SMT. But overall, the two fetch/decode clusters are far better suited to act as a secondary source of instruction delivery. And that’s the role they play across SPEC CPU2017’s workloads on Zen 5.
Frontend Activity
Performance counters can provide additional insight into how hard the frontend is getting pushed. Here, I’m using event 0xAA, which counts micro-ops dispatched from the frontend and provides unit masks to filter by source. I’m also setting the count mask to 1 to count cycles where the frontend is sending ops to the backend from either source (op cache or decoders).
A single 4-wide decoder isn’t adequate for high IPC workloads, and performance monitoring data backs that up. The frontend has to work overtime in decoder-only mode, and it gets worse as IPC gets higher.
SPEC CPU2017’s floating point tests make everything more extreme. The floating point suite has a surprising number of moderate IPC workloads that seem to give the decoders a really rough time. For example, 519.lbm averages below 3 IPC and normally doesn’t stress Zen 5’s frontend. But with the op cache off, suddenly the frontend busy for over 90% of core active cycles.
SMT increases parallelism and thus potential core throughput, placing higher demand on frontend bandwidth. With the op cache on, frontend load goes up but everything is well within the frontend’s capabilities. With the op cache off, the decoders do an excellent job of picking up the slack. The frontend is a little busier, but the decoders aren’t getting pegged except in very high IPC outliers like 548.exchange2. And exchange2 is a bit of an unfair case because it even pushes the op cache hard.
The strange jump in decoder utilization across SPEC CPU2017’s floating point tests is gone with both SMT threads active. Likely, the two decode clusters together have enough headroom to hide whatever inefficiencies show up in single threaded mode.
Extremely high IPC workloads like 538.imagick do push the clustered decoder quite hard. But overall, the 2×4 decode scheme does well at handling SMT.
Cyberpunk 2077
Cyberpunk 2077 is a game that rewards holding down the tab key. It also features a built-in benchmark. Built-in benchmarks don’t always provide the best representation of in-game performance, but do allow for more consistency without a massive time investment. To minimize variation, I ran the Ryzen 9 9900X with Core Performance Boost disabled. That caps clock speed at 4.4 GHz, providing consistent performance regardless of which core code is running on, or how many cores are active. I’ve also capped by Radeon RX 6900XT to 2 GHz to minimize GPU-side boost clock variation. However, I’m testing at 1080P with medium settings, so the GPU side shouldn’t be a limiting factor.

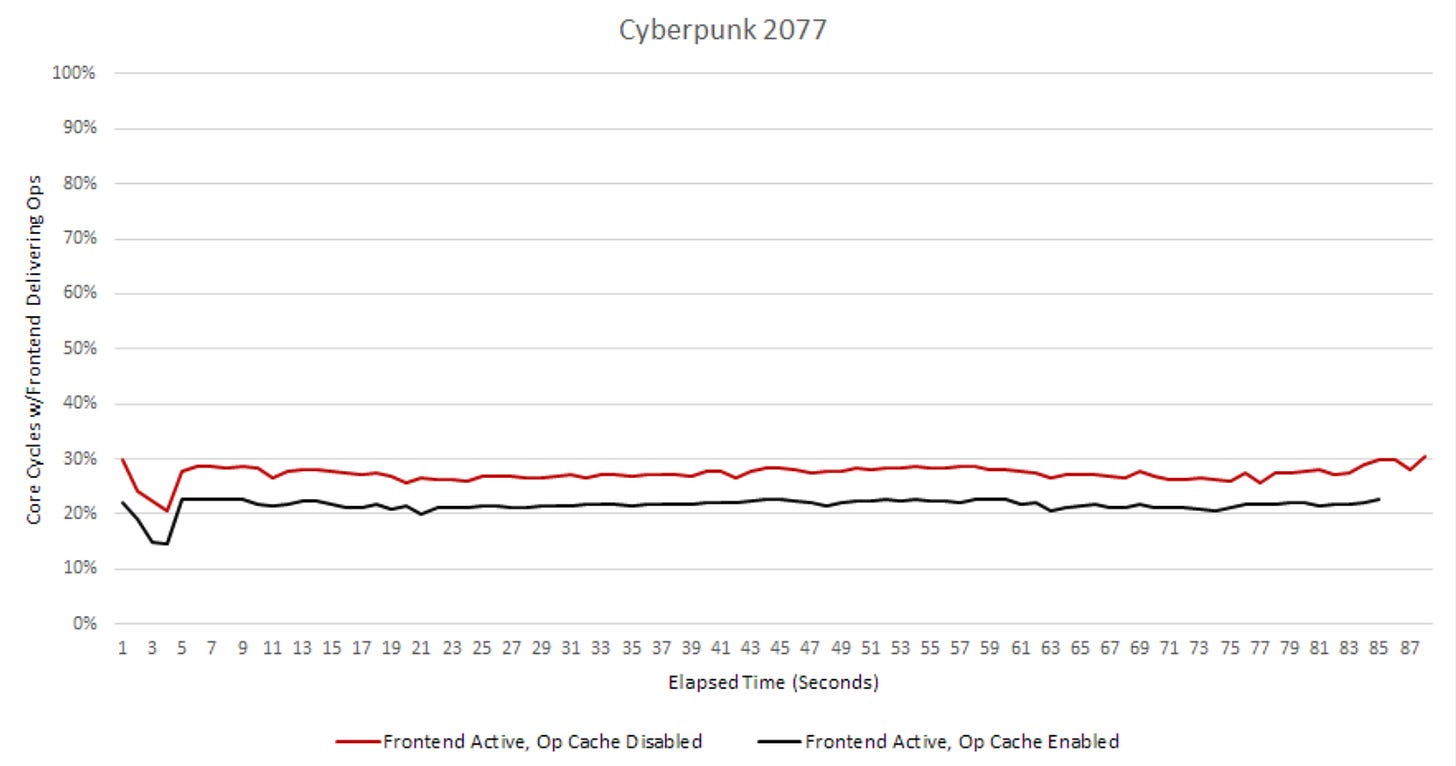
Turning the op cache on or off doesn’t make a big difference. That’s notable because games usually don’t run enough threads to benefit from SMT, especially on a high core count chip like the 9900X. However, games are also usually low IPC workloads and don’t benefit from the op cache’s high throughput. Cyberpunk 2077 certainly fits into that category, averaging just below 1 IPC. The Ryzen 9 9900X delivers just 0.17% better performance with the op cache enabled.
In its normal configuration, Zen 5 sources 83.5% of micro-ops from the op cache. Hitrate isn’t quite as high as most of SPEC CPU2017’s workloads, with the notable exception of 507.cactuBSSN. However, that’s still enough to position the op cache as the primary source of instruction delivery.
On average, the frontend uses the op cache for 16.3% of core active cycles, and the decoders for 5.3%. Zen 5’s frontend spends much of its time idle, as you’d expect for a low IPC workload. With the decoders carrying all the load, the frontend delivers ops over 27.4% of core active cycles.
The decoders have to work a bit harder to feed the core, but they still have plenty of time to go on a lunch break, get coffee, and take a nap before getting back to work.
Grand Theft Auto V
Grand Theft Auto V (GTA V) is an older game with plenty of red lights. Again, I’m running with Core Performance Boost disabled to favor consistency over maximum performance. Don’t take these results, even ones with the op cache enabled, to be representative of Zen 5’s stock performance.
Disabling the op cache basically makes no difference, except in the fourth pass, where the op cache gave a 1.3% performance boost. I don’t think that counts either, because no one will notice a 1.3% performance difference.
Zen 5’s op cache covers 77% of the instruction stream on average. Like Cyberpunk 2077, GTA V has a larger instruction footprint than many of SPEC CPU2017’s workloads. The op cache does well from an absolute perspective, but the decoders still handle a significant minority of the instruction stream.
Like Cyberpunk 2077, GTA V averages just under 1 IPC. That won’t stress frontend throughput. On average, the frontend delivered ops in op cache mode over 16.4% of active cycles, and did so in decoder mode over 7.9% of active cycles.
With everything forced onto the decoders, the frontend delivers ops over 29.5% of active cycles. Again, the frontend is busier, but those decoders still spend most of their time on break.
Cinebench 2024
Cinebench 2024 is a popular benchmark among enthusiasts. It’s simple to run, leading to a lot of comparison data floating around the internet. That by itself makes the benchmark worth paying attention to. I’m again running with Core Performance Boost disabled to provide consistent clock speeds, because I’m running on Windows and not setting core affinity like I did with SPEC CPU2017 runs.
Single threaded mode has the op cache giving Zen 5 a 13.5% performance advantage over decoder-only mode. That’s in line with many of SPEC CPU2017’s workloads. Cinebench 2024 averages 2.45 IPC, making it a much higher IPC workload than the two games tested above. Op cache hitrate is closer to Cyberpunk 2077, at 84.4%. Again, that’s lower than in most SPEC CPU2017 workloads.
Higher IPC demands more frontend throughput. Zen 5’s frontend was feeding the core from the op cache over 35.4% of cycles, and did so from the decoder over 11.5% of cycles. Frontend utilization is thus higher than in the two games tested above. Still, the frontend is spending most of its time on break, or waiting for data.
Turn off the op cache, and IPC drops to 2.15. The decoders see surprisingly heavy utilization. On average they’re busy over 69% of core active cycles. I don’t know what’s going on here, but the same pattern showed up over some of SPEC CPU2017’s floating point workloads. Cinebench 2024 does use a lot of floating point operations, because 42.8% of ops from the frontend were dispatched to Zen 5’s floating point side.
I ran Cinebench and game tests on Windows, where I use my own performance monitoring program to log results. I wrote the program to give myself stats updated every second, because I wanted a convenient way to see performance limiters in everyday tasks. I later added logging capability, which logs on the same 1-second intervals. That gives me per-second data, unlike perf on Linux where I collect stats over the entire run. I can also shake things up and plot those 1-second intervals with IPC on one axis, and frontend busy-ness on the other.
Cinebench 2024 exhibits plenty of IPC variation as the benchmark renders different tiles. IPC can go as high as 3.63 over a one second interval (with the op cache on), which can push the capabilities of a single 4-wide decoder. Indeed, a single 4-wide decoder cluster starts to run out of headroom during higher IPC portions of Cinebench 2024’s single threaded test.
As an aside, ideally I’d have even faster sampling rates. But writing a more sophisticated performance monitoring program isn’t practical for a free time project. And I still think the graph above is a cool illustration of how the 4-wide decoder starts running out of steam during higher IPC sections of the benchmark, while the op cache has plenty of throughput left on tap.
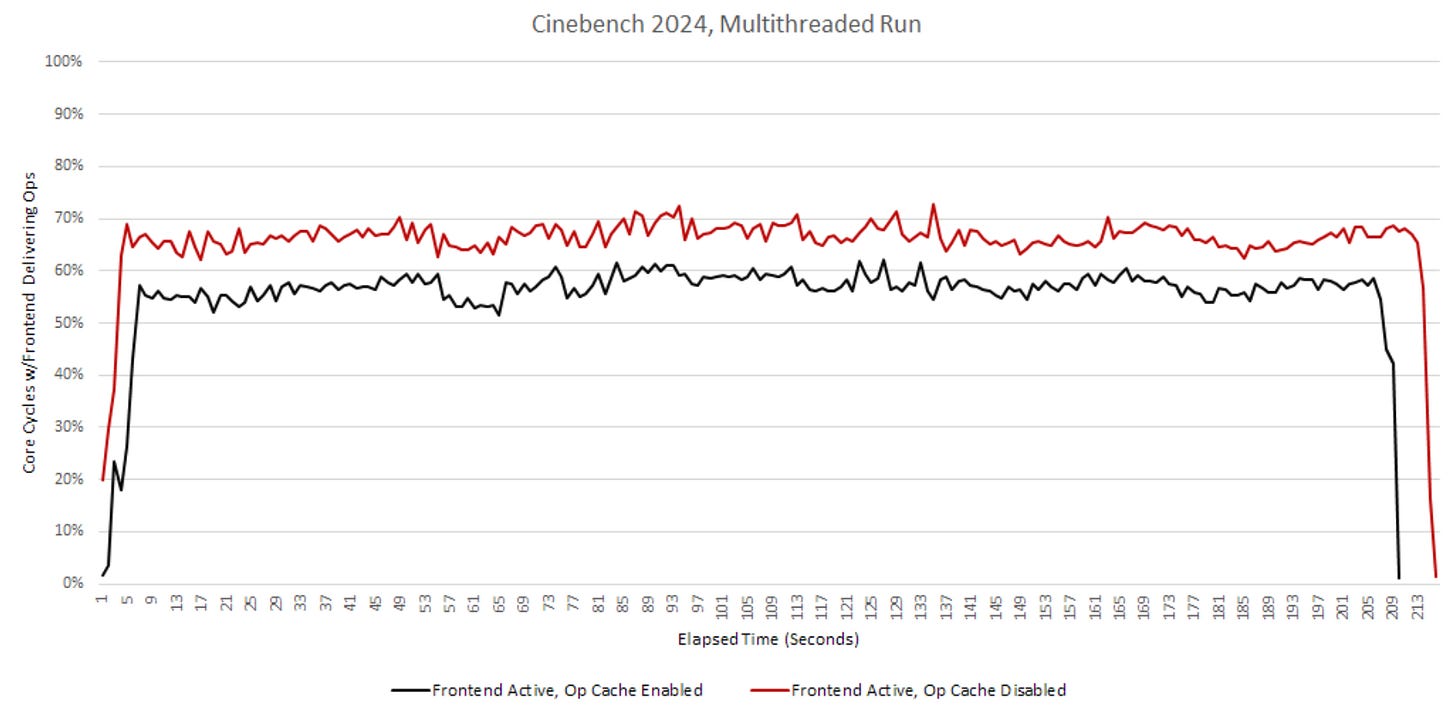
Of course no one runs a rendering program in single threaded mode. I haven’t used Maxon’s Cinema 4D before, but Blender will grab all the CPU cores it can get its hands on right out of the box. In Cinebench 2024’s multi-threaded mode, I see just a 2.2% score difference with op cache enabled or disabled. Again, the two decode clusters show their worth in a multithreaded workload.
Cinebench 2024 sees its op cache hitrate drop to 78.1% in multi-threaded mode, highlighting how multiple threads put extra pressure on cache capacity. During certain 1-second intervals, hitrate can drop below 70%. Even though the op cache continues to do most of the work, Cinebench 2024’s multithreaded mode taps into the decoders a little more than other workloads here.

Disabling the op cache dumps a lot more load onto the decoders, but having two decode clusters lets the frontend handle it well. The decoders still can’t do as well as the op cache, and the frontend is a bit busier in pure-decoder mode. But as the overall performance results show, the decoders are still mostly keeping up.
Final Words
Turning off Zen 5’s op cache offers a glimpse of how a modern core may perform when fed from a Steamroller-style decoder layout. With two 4-wide decoders, single threaded performance isn’t great, but SMT performance is very good. Single threaded performance is still of paramount performance in client workloads, many of which can’t take advantage of high core counts, let alone SMT threads. Zen 5’s op cache therefore plays an important role in letting Zen 5 perform well. No one would design a modern high performance core fed purely off a Steamroller-style frontend, and it’s clear why.
But this kind of dual cluster decoder does have its place. Two threads present the core with a larger cache footprint, and that applies to the instruction side too. Zen 5’s op cache is very often large enough to cover the vast majority of the instruction stream, even with both SMT threads in use. However, there are cases like Cinebench 2024 where the decoders sometimes have work to do.
I think Zen 5’s clustered decoder targets these workloads. It takes a leaf out of Steamroller’s over-engineered frontend, and uses it to narrowly address cases where core IPC is likely to be high and code locality is likely poor. Specifically, that’s the SMT case. The clustered decoder is likely part of AMD’s strategy to cover as many bases as possible with a single core design. Zen 5’s improved op cache focuses on maximizing single threaded performance, while the decoders step in for certain multithreaded workloads where the op cache isn’t big enough.

In the moment, Zen 5’s frontend setup makes a lot of sense. Optimizing a CPU design is all about striking the right balance. Zen 5’s competitive performance speaks for itself. But if we step back a few months to Hot Chips 2024, AMD, Intel, and Qualcomm all gave presentations on high performance cores there. All three were eight-wide, meaning their pipelines could handle up to eight micro-ops per cycle in a sustained fashion.
Zen 5 is the only core out of the three that couldn’t give eight decode slots to a single thread. Intel’s Lion Cove might not take the gaming crown, but Intel’s ability to run a plain 8-wide decoder at 5.7 GHz should turn some heads. For now, that advantage doesn’t seem to show up. I haven’t seen a high IPC, low-threaded workload with a giant instruction-side cache footprint. But who knows what the future will bring.
If you like the content then consider heading over to the Patreon or PayPal if you want to toss a few bucks to Chips and Cheese. Also consider joining the Discord.








Great article, as always. I really appreciate these articles that might not have practical relevance but help to explain the decisions taken and trade-offs made by Chip Designers.
Another aspect of interest for me would have been the impact on power efficiency when disabling the OpCache. Did the consumption (in W) increase significantly? How much did it impact the overall energy needed for a given fixed workload like a CB24 run in J/Ws?
Dumb questions..
how do u declare and initialize and array of NOPs?
__asm__ __volatile__(".byte 0x90") or __asm__ __volatile__("nop")
like this?
void (*func_ptr[4])(void) {
&Test_nops,
&Test_nops,
&Test_nops,
&Test_nops
};
void Test_Nops(void) {
__asm__ __volatile__("nop");
return;
};
2) It shows Zen_cores has 2-sets of 4-wide Decoders. (is it on a per core basis?, that's 1 core 8 decoders) hence if i got a 8-cores CPU (say the X3D, then in totality my CPU have 8*8==64 decoders