Condor’s Cuzco RISC-V Core at Hot Chips 2025
Condor Computing, a subsidiary of Andes Technology that creates licensable RISC-V cores, has a business model with parallels to Arm (the company) and SiFive. Andes formed Condor in 2023, so Condor is a relatively young player on the RISC-V scene. However, Andes does have RISC-V design experience prior to Condor’s formation with a few RISC-V cores under their belt from years past.
Condor is presenting their Cuzco core at Hot Chips 2025. This core is a heavyweight within the RISC-V scene, with wide out-of-order execution and a modern branch predictor and some new time based tricks. It’s in the same segment as high performance RISC-V designs like SiFive’s P870 and Veyron’s V1. Like those cores, Cuzco should stand head and shoulders above currently in-silicon RISC-V cores like Alibaba T-HEAD’s C910 and SiFive’s P550.
Besides being a wide out-of-order design, Cuzco uses mostly static scheduling in the backend to save power and reduce complexity. Condor calls this a “time-based” scheduling scheme. I’ll cover more on this later, but it’s important to note that this is purely an implementation detail. It doesn’t require ISA modifications or special treatment from the compiler for optimal performance.
Core Overview
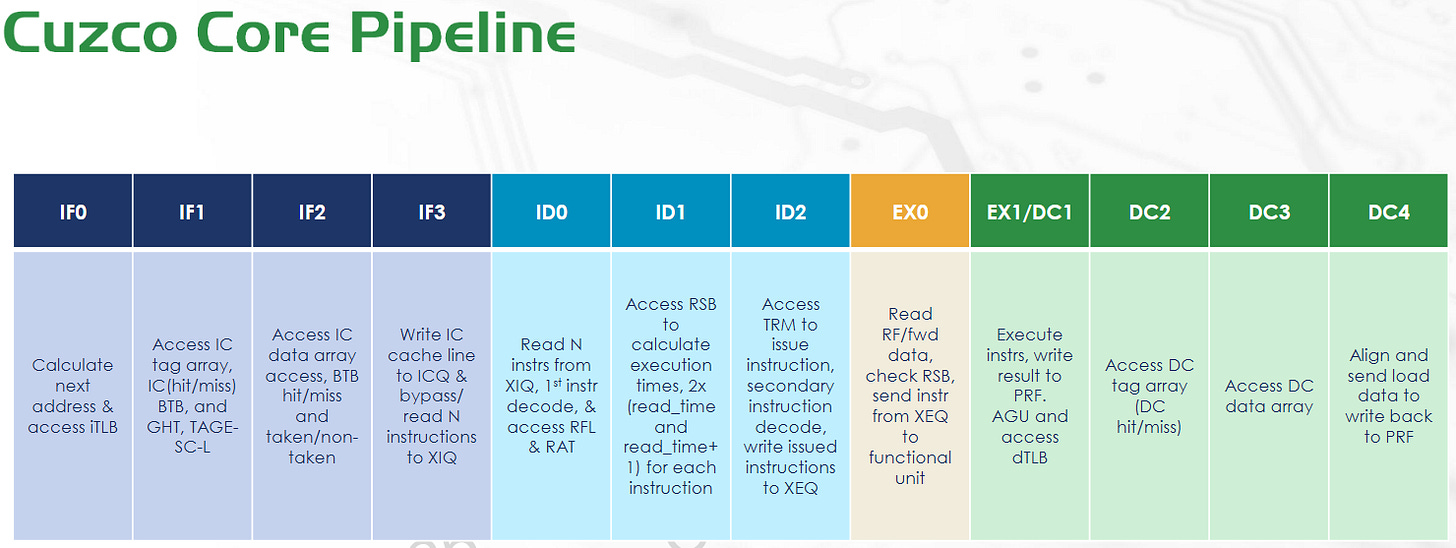
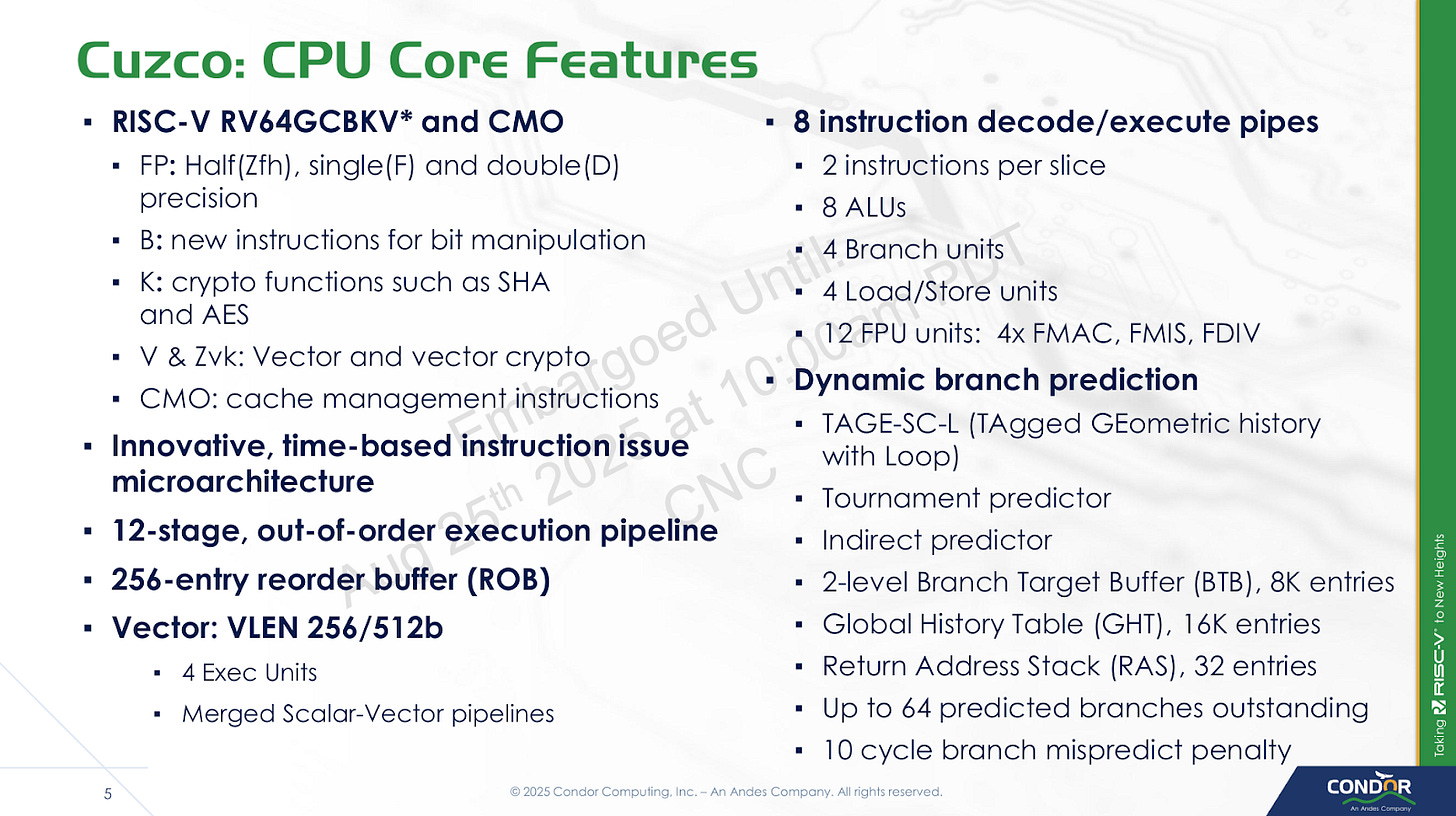
Cuzco is a 8-wide out-of-order core with a 256 entry ROB and clock speed targets around 2 GHz SS (Slow-Slow) to 2.5 GHz (Typical-Typical) on TSMC’s 5nm process. The pipeline has 12 stages counting from instruction fetch to data cache access completion. However, a 10 cycle mispredict penalty probably more accurately describes the core’s pipeline length relative to its competitors.
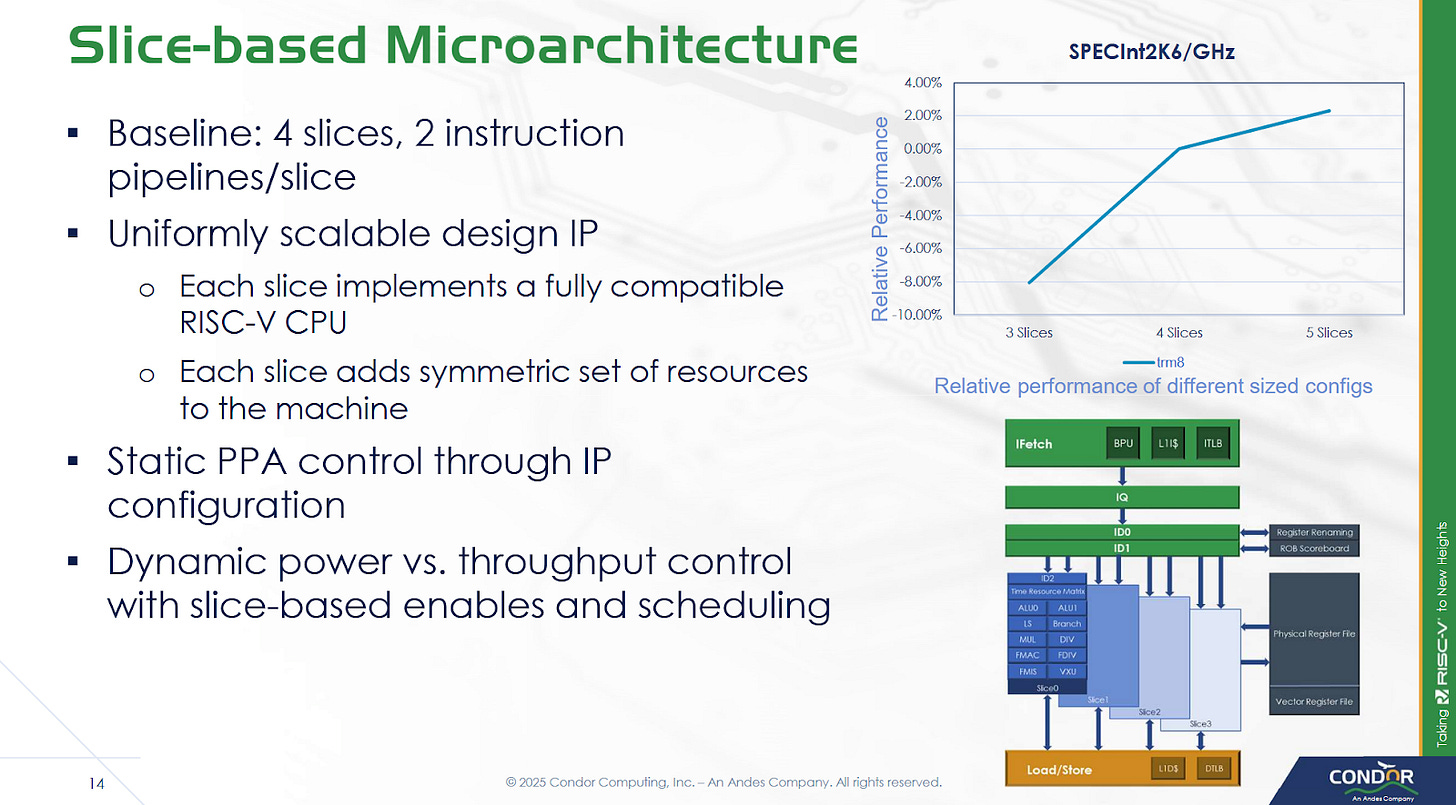
As a licensed core, Cuzco is meant to be highly configurable to widen its target market. The core is built from a variable number of execution slices. Customization options also include L2 TLB size, off-cluster bus widths, and L2/L3 capacity. Condor can also adjust the size of various internal core structures to meet customer performance requirements. Cuzco cores are arranged into clusters with up to eight cores. Clusters interface with the system via a CHI bus, so customers can bring their own network-on-chip (NoC) to hit higher core counts via multi-cluster setups.
Frontend
Cuzco’s frontend starts with a sophisticated branch predictor, as is typical for modern cores targeting any reasonable performance level. Conditional branches are handled via a TAGE-SC-L predictor. TAGE stands for Tagged Geometric, a technique that uses multiple tables each handling a different history length. It seeks to efficiently use branch predictor storage by selecting the most appropriate history length for each branch, as opposed to older techniques that use a fixed history length. The SC (Statistical Corrector) part handles the small subset of branches where TAGE doesn’t work well, and can invert the prediction if it sees TAGE often getting things wrong under certain circumstances. Finally, L indicates a loop predictor. A loop predictor is simply a set of counters that come into play for branches that are taken a certain number of times, then not taken once. If the branch predictor detects such loop behavior, the loop predictor can let it avoid mispredicting on the last iteration of the loop. Basically, TAGE-SC-L is an augmented version of the basic TAGE predictor.
AMD’s Zen 2, Ampere’s AmpereOne, and Qualcomm’s Oryon also use TAGE predictors of some sort, and achieve excellent branch prediction accuracy. AMD, Ampere, and Qualcomm also likely augment the basic TAGE prediction strategy in some way. How Cuzco’s TAGE predictor performs will depend on how large its history tables are, as well as how well the predictor is tuned (selection of index vs tag bits, history lengths, distribution of storage budget across TAGE tables, etc). For Cuzco’s part, they’ve disclosed that the TAGE predictor’s base component uses a 16K entry table of bimodal counters.
Branch target caching on Cuzco is provided by a 8K entry branch target buffer (BTB) split into two levels. Condor’s slides show the BTB hit/miss occurring on the cycle after instruction cache access starts, so a taken branch likely creates a single pipeline bubble. Returns are predicted using a 32 entry return stack. Cuzco also has an indirect branch predictor, which is typical on modern CPUs.
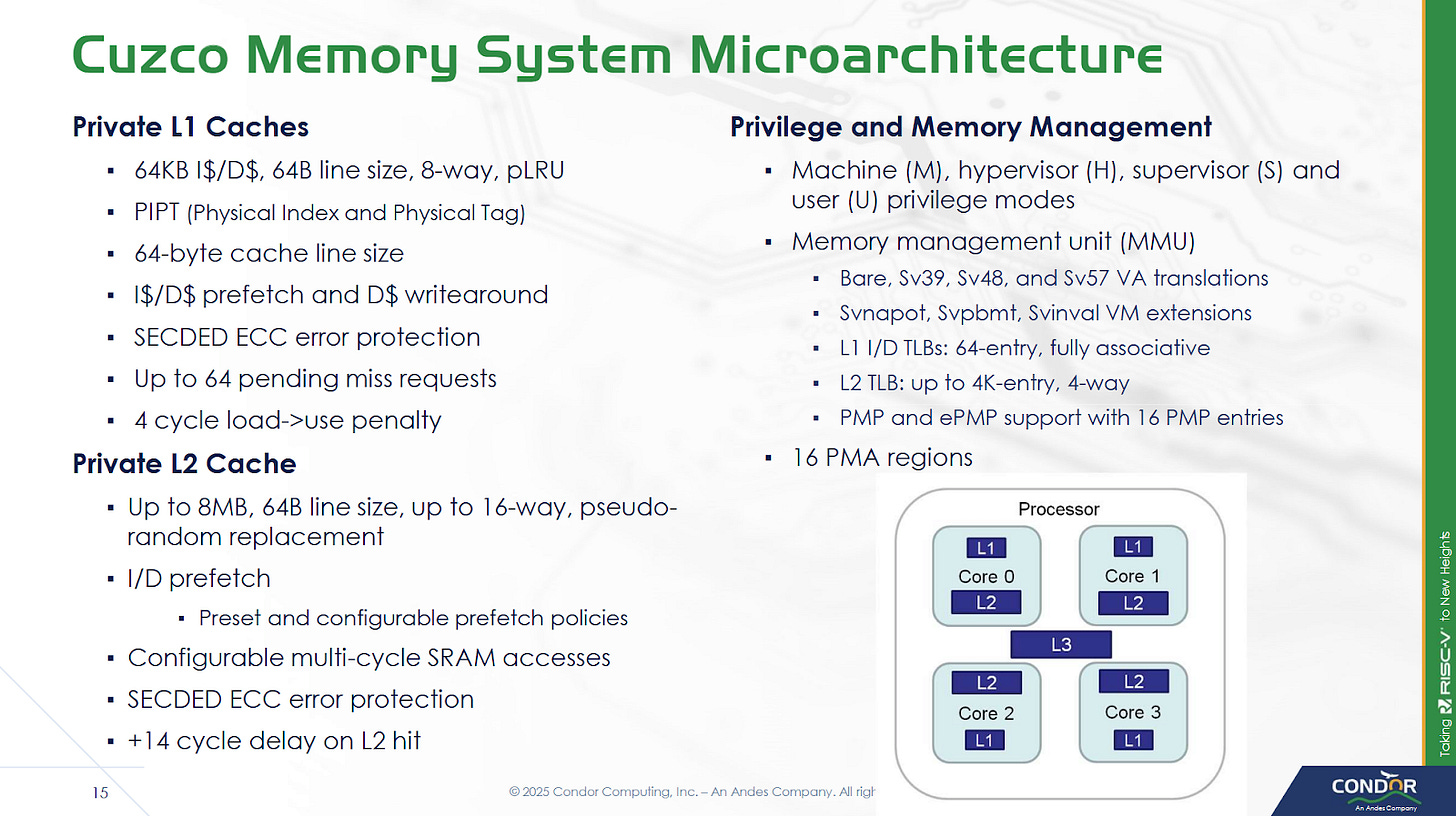
Cuzco’s instruction fetch logic feeds from a 64 KB 8-way set associative instruction cache, and speeds up address translations with a 64 entry fully associative TLB. The instruction fetch stages pull an entire 64B cacheline into the ICQ (instruction cache queue), and then pull instructions from that into an instruction queue (XIQ). The decoders feed from the XIQ, and can handle up to eight instructions per cycle.
Rename and Allocate
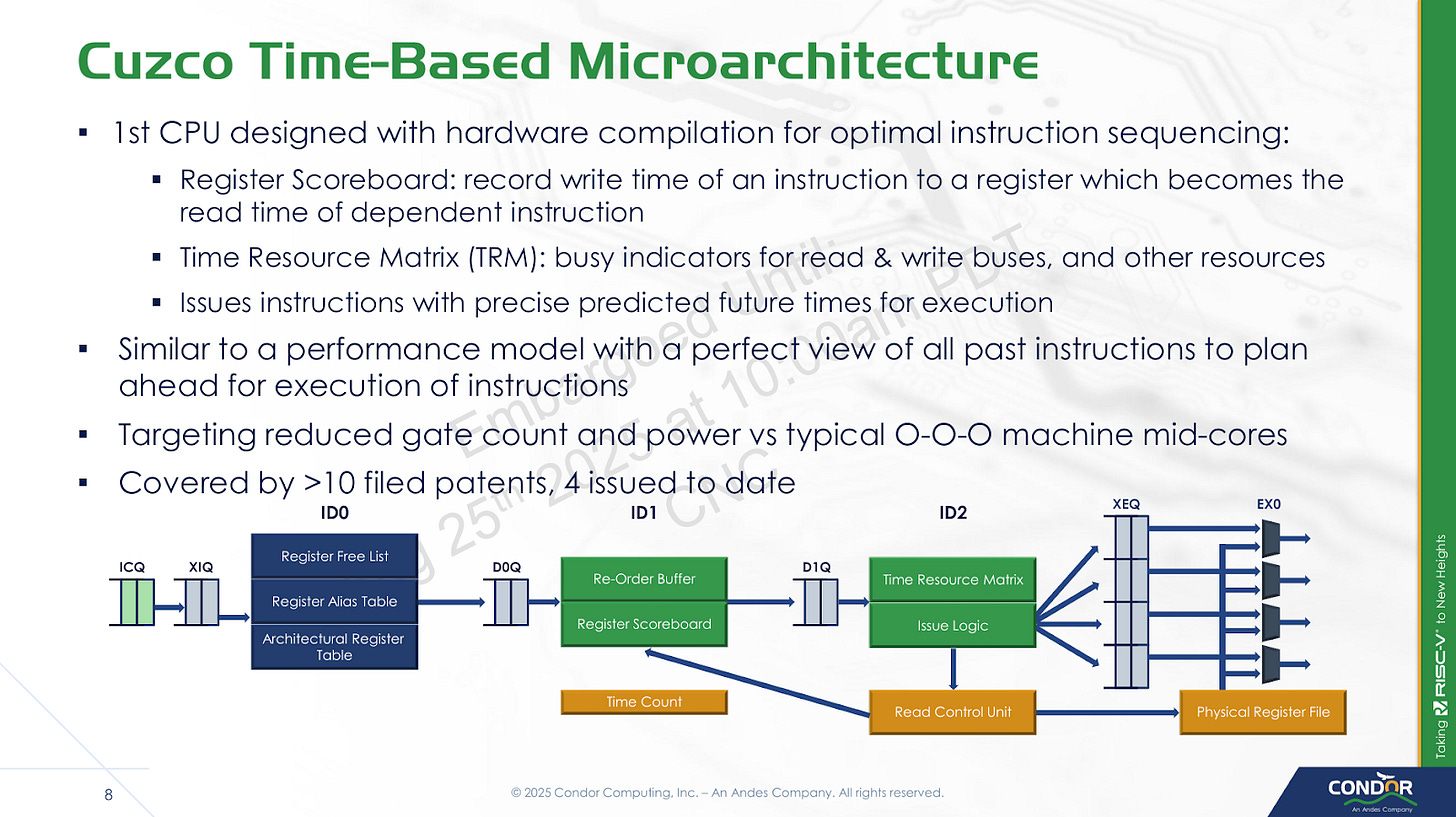
Much of the action in Condor’s presentation relates to the rename and allocate stage, which acts as a bridge between the frontend and out-of-order backend. In most out-of-order cores, the renamer carries out register renaming and allocates resources in the backend. Then, the backend dynamically schedules instructions as their dependencies become available. Cuzco’s renamer goes a step further and predicts instruction schedules as well.
One parallel to this is Nvidia’s static scheduling in Kepler and subsequent GPU architectures. Both simplify scheduling by telling an instruction to execute a certain number of cycles in the future, rather than having hardware dynamically check for dependencies. But Nvidia does this in their compiler because GPU ISAs aren’t standardized. Cuzco still uses hardware to create dynamic schedules, but moves that job into the rename/allocate stage rather than the schedulers in the backend. Schedulers can be expensive structures in conventional out-of-order CPUs, because they have to check whether instructions are ready to execute every cycle. On Cuzco, the backend schedulers can simply wait a specified number of cycles, and then issue an instruction knowing the dependencies will be ready by then.
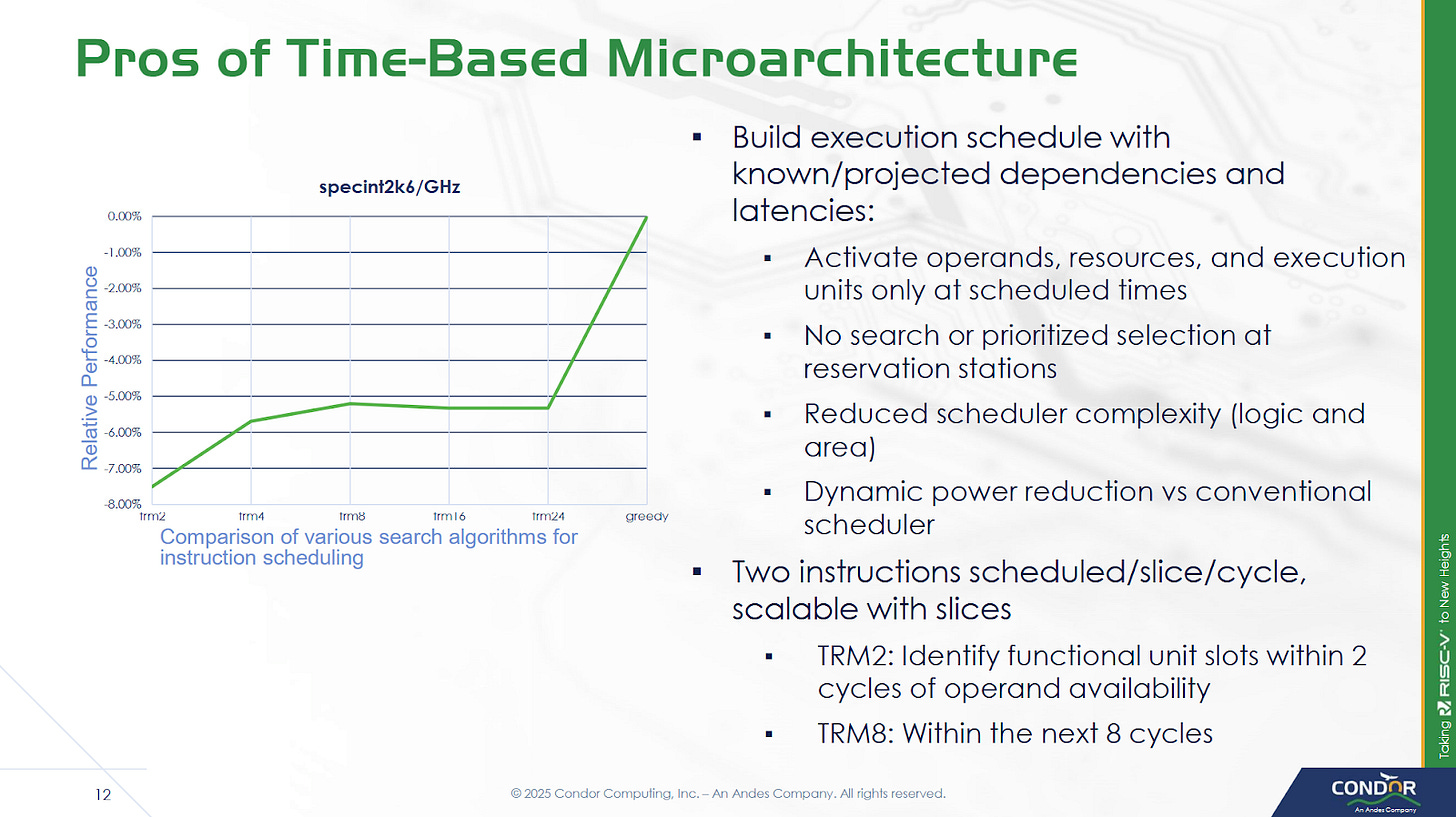
To carry out time-based scheduling, Cuzco maintains a Time Resource Matrix (TRM), which tracks utilization of various resources like execution ports, functional units, and data buses for a certain number of cycles in the future. The TRM can look 256 cycles into the future, which keeps storage requirements under control. Because searching a 256 row matrix in hardware would be extremely expensive, Cuzco only looks for available resources in a small window after an instruction’s dependencies are predicted to be ready. Condor found searching a window of eight cycles provided a good tradeoff. Because the renamer can handle up to eight instructions, it at most has to access 64 rows in the TRM per cycle. If the renamer can’t find free resources in the search window, the instruction will be stalled at the ID2 stage.
Another potential limitation is the TRM size, which could be a limitation for long latency instructions. However, the longest latency instructions tend to be loads that miss cache. Cuzco always assumes a L1D hit for TRM scheduling, and uses replay to handle L1D misses. That means stalls at ID2 from TRM size limitations should also be rare.
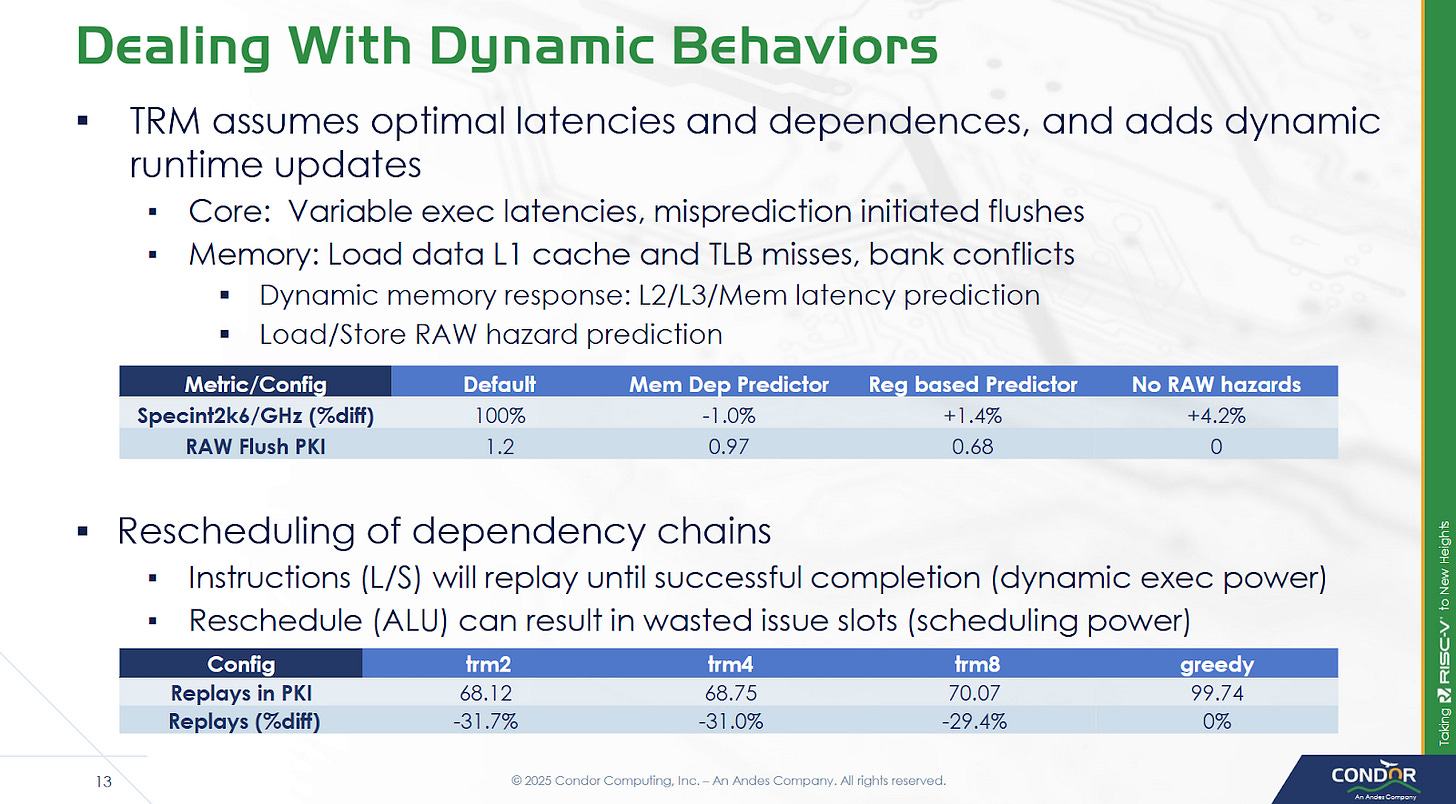
Compared to a hypothetical “greedy” setup, where the core is able to create a perfect schedule with execution resource limitations in mind, limiting the TRM search window decreases performance by a few percent. Condor notes that creating a core to match the “greedy” figure may not even be possible. A conventional out-of-order core wouldn’t have TRM-related restrictions, but may face difficulties creating an optimal schedule for other reasons. For example, a distributed scheduler may have several micro-ops become ready in one scheduling queue, and face “false” delays even though free execution units may be available on other scheduling queues.
Static scheduling only works when instruction latencies are known ahead of time. Some instructions have variable latency, like loads that can miss caches or TLBs, encounter bank conflicts, or require store forwarding. As mentioned before, Cuzco uses instruction replay to handle variable latency instructions and the associated dynamic behavior. The renamer does take some measures to reduce replays, like checking to see if a load gets its address from the same register as a prior store. However, it doesn’t attempt to predict memory dependencies like Intel’s Core 2, and also doesn’t try to predict whether a load will miss cache.
Out-of-Order Backend
Out of order execution in Cuzco is relatively simple, because the rename/allocate stage takes care of figuring out when instructions will execute. Each instruction is simply held within the schedulers until a specified number of cycles pass, after which it’s sent for execution. If the rename/allocate stage guesses wrong, replay gets handled via “poison” bits. The erroneously executed instruction’s result data is effectively marked as poisoned, and any instructions consuming that data will get re-executed. Replaying instructions costs power and wastes execution throughput, so replays should ideally be a rare event. 70.07 replays per 1000 instructions feels like a bit of a high figure, but likely isn’t a major problem because execution resources are rarely a limitation in an out-of-order core. Taking about 7% more execution resources may be an acceptable tradeoff, considering most modern chips rarely use their core width in a sustained fashion.
Execution resources are grouped into slices, each of which have a pair of pipelines. A slice can execute all of the core’s supported RISC-V instructions, making it easy to scale execution resources by changing slice count. Each slice consists of a set of execution queues (XEQs), which hold micro-ops waiting for a functional unit. Cuzco has XEQs per functional unit, unlike conventional designs that tend to have a scheduling queue that feeds all functional units attached to an execution port. Four register read ports supply operands to the slice, and two write ports handle result writeback. Bus conflicts are handled by the TRM as well. A slice cannot execute more than two micro-ops per cycle, even doing so would not oversubscribe the register read ports. For example, a slice can’t issue an integer add, a branch, and a load in the same cycle even though that would only require four register inputs.
XEQs are sized to match workload characteristics, much like tuning a distributed scheduler. While XEQ sizes can be set to match customer requirements, Condor was able to give some figures for a baseline configuration. ALUs get 16 entry queues, while branches and address generation units (LS) get 8 entry queues. XEQ sizes are adjustable in powers of two, from 2 to 32 entries. There’s generally a single cycle of latency for forwarding between slices. The core can be configured to do zero cycle cross-slice forwarding, but that would be quite difficult to pull off.
On the vector side, Cuzco supports 256/512-bit VLENs via multiple micro-ops, which are distributed across the execution slices. Execution units are natively 64 bits wide. There’s one FMA unit per slice, so peak FP32 throughput is eight FMA operations per cycle, or 16 FLOPS when counting the add and multiply as separate operations. FP adds execute with 2 cycle latency, while FP multiplies and multiply-adds have four cycle latency. The two cycle FP add latency is nice to see, and matches recent cores like Neoverse N1 and Intel’s Golden Cove, albeit at much lower clocks.
Load/Store
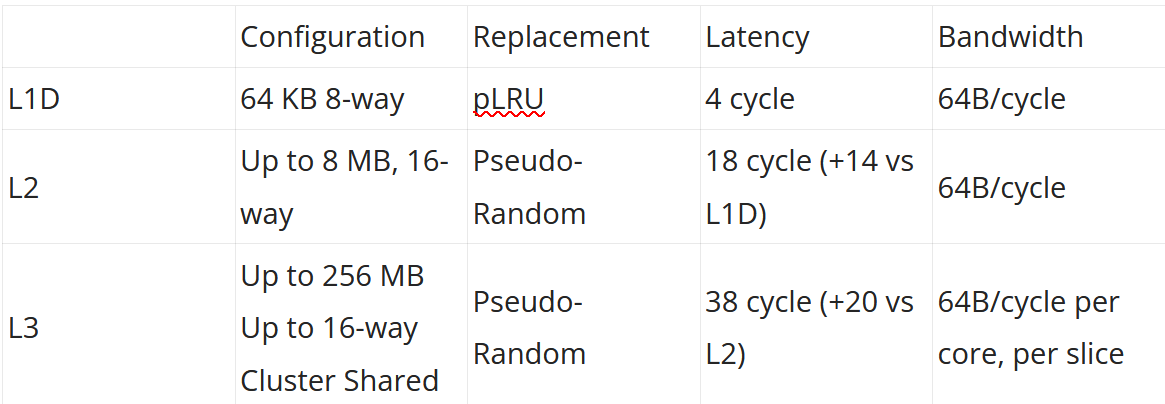
Cuzco’s load/store unit has a 64 entry load queue, a 64 entry store queue, and a 64 entry queue for data cache misses. Loads can leave the load queue after accessing the data cache, likely creating behavior similar to AMD’s Zen series where the out-of-order backend can have far more loads pending retirement than the documented load queue capacity would suggest. The core has four load/store pipelines in a four slice configuration, or one pipeline per slice. Maximum load bandwidth is 64B/cycle, achievable with vector loads.
The L1D is physically indexed and physically addressed (PIPT), so address translation has to complete before L1D access.To speed up address translation, Cuzco has a 64 entry fully associative data TLB. The L2 TLB is 4-way set associative, and can have 1K, 2K, or 4K entries. Cuzco’s core private, unified L2 cache has configurable capacity as well. An example 2 MB L2 occupies 1.04 mm2 on TSMC 5nm.
Eight cores per cluster share a L3 cache, which is split into slices to handle bandwidth demands from multiple cores. Each slice can deliver 64B/cycle, and slice count matches core count. Thus Cuzco enjoys 64B/cycle of load bandwidth throughout the cache hierarchy, of course with the caveat that L3 bandwidth may be lower if accesses from different cores clash into the same slice. Cores and L3 slices within a cluster are linked by a crossbar. The L3 cache can run at up to core clock. Requests to the system head out through a 64B/cycle CHI interface. System topology beyond the cluster is up to the implementer.
Replays for cache misses are carried out by rescheduling the data consumer to a later time when data is predicted to be ready. Thus a L3 hit would cause a consuming instruction to be executed three times - once for the predicted L1D hit, once for the predicted L2 hit, and a final time for the L3 hit with the correct data.
Final Words
High performance CPU design has settled down over the past couple decades, and converged on an out-of-order execution model. There’s no denying that out-of-order execution is difficult. Numerous alternatives have been tried through the years but didn’t have staying power. Intel’s Itanium sought to use an ISA-based approach, but failed to unseat the company’s own x86 cores that used out-of-order execution. Nvidia’s Denver tried to dynamically compile ARM instructions into microcode bundles, but that approach was not carried forward. All successful high performance designs today generally use the same out-of-order execution strategy, albeit with plenty of variation. That’s driven by the requirements of ISA compatibility, and the need to deliver high single threaded performance across a broad range of applications. Breaking from the mould is obviously fraught with peril.
Condor seeks to break from the mould, but does so deep in the core in a way that should be invisible to software a functional perspective, and mostly invisible from a performance perspective. The core runs RISC-V instructions and thus benefits from that software ecosystem, unlike Itanium. It doesn’t rely on a compiled microcode cache like Denver, so it doesn’t end up running in a degraded performance beyond what a typical OoO core would see when dealing with poor code locality. Finally, instruction replay effectively creates dynamic schedules and handles cache misses
If you like the content then consider heading over to the Patreon or PayPal if you want to toss a few bucks to Chips and Cheese. Also consider joining the Discord.





I didn’t notice whose article I was reading. Saw the Chips and Cheese note at the end. Immediately went, “Oh, of course.”
Nobody else does analysis like this. Wow.
First, thanks Chester for another great article!
Regarding the RISC-V CPU design here: their main problem will be to find one or more customers to license it, as an at-risk production is a very high risk indeed for any company that is not a hyperscaler. Hyperscaler have a captive audience for their designs, which is a key reason why Graviton made it. Of course AWS owned and still owns Anapurna, and AWS was willing to invest and push Graviton at (initially) substantial discounts over x86 instances. Of course, that worked out really well for AWS.
In contrast, Ampere didn't have that very large in-house customer, and struggled finding their niche for their ARM-based designs. With a large RISC-V multicore CPU, the challenge is likely even greater, unless the CPU is adopted by a large player like Tencent or Alibaba, which are interested in RISC-V designs.