Raytracing on Meteor Lake’s iGPU
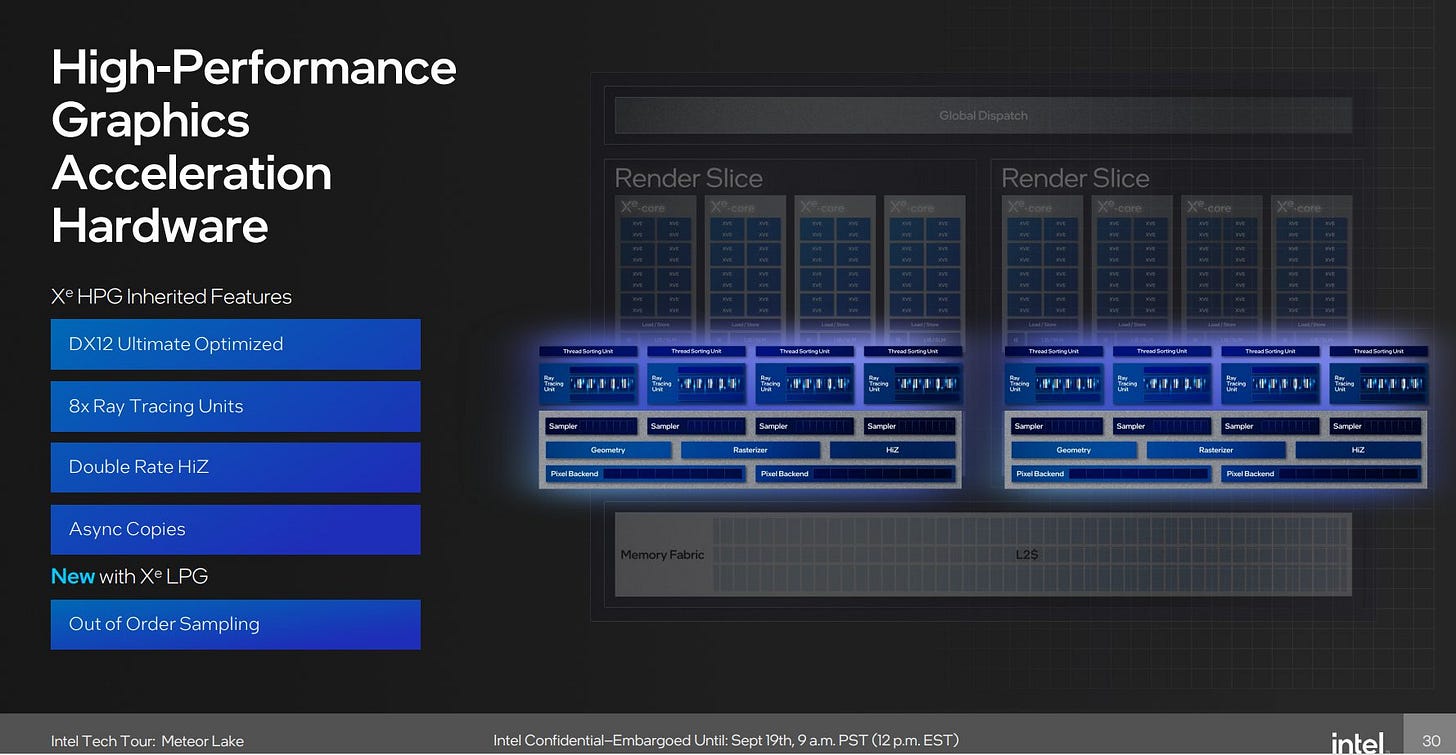
Meteor Lake iGPU is a testament to Intel’s mobile graphics aspirations. It’s almost a quarter of an Arc A770. The Xe-LPG architecture used in Meteor Lake inherits Xe-HPG (A770) traits, including hardware raytracing. Here I’ll note a few observations on Intel’s raytracing implementation, using both their official documentation and profiling tools. I’ll also compare with AMD’s raytracing approach. Nvidia would be interesting too, but unfortunately I don’t have enough info on their hardware raytracing for a comparison with them.
I covered Meteor Lake’s GPU architecture in a prior article, and will be using Intel specific terms. Reading that article first is probably a good idea. I’ll also assume familiarity with raytracing acceleration structures like BVH-es.
Raytracing Acceleration Architecture
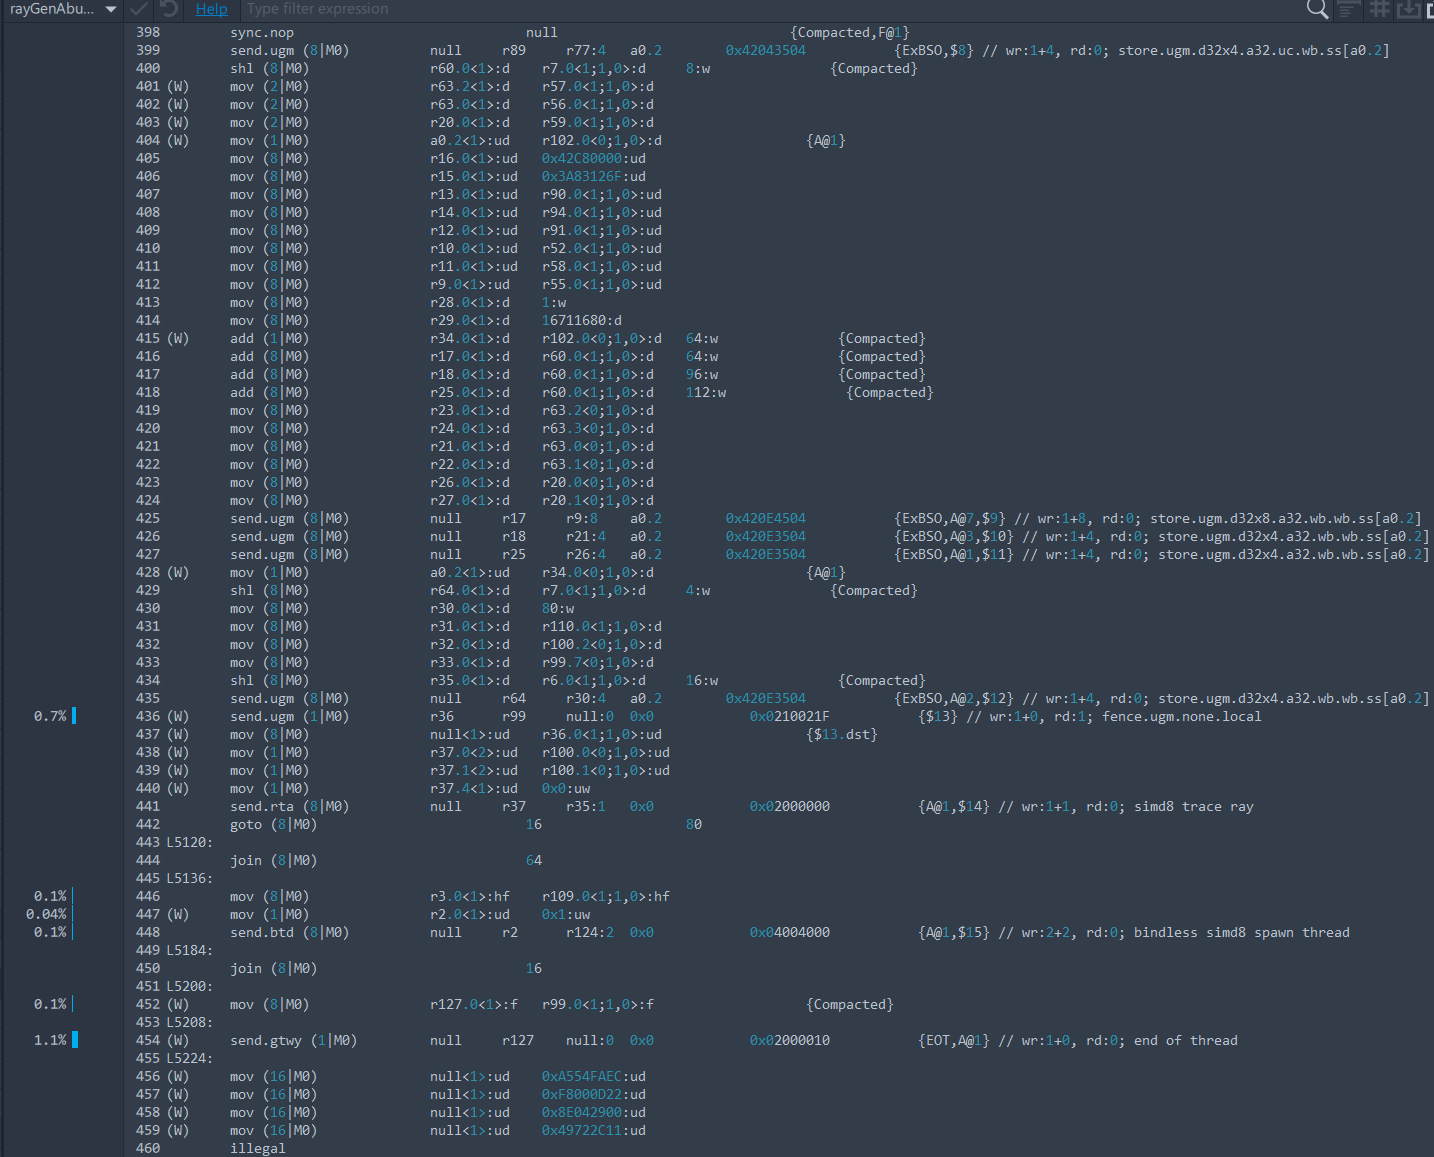
Raytracing involves traversing a bounding volume hierarchy (BVH), taking a divide-and-conquer approach to avoid doing intersection tests against every piece of geometry in a scene. Intel takes an aggressive approach to raytracing by handling most of the traversal BVH process in fixed function hardware. The shader array’s general purpose execution units are only used to initiate ray traversal and handle results. Furthermore, each shader program has a relatively short lifetime and terminates once it hands control back to the raytracing accelerator (RTA).

Intel’s RTA sits alongside other Xe Core resources like the L1 cache and texture units. Xe Vector Engines (XVEs) access the RTA by sending it a message over the Xe-Core’s internal interconnect. Shader programs terminate shortly after handing off traversal work to the RTA. Once the RTA gets to the bottom of the BVH, it sorts rays to maximize coherence within Xe-LPG’s vector width, and invokes hit/miss shader programs by talking back to the Xe Core’s thread dispatch logic.
This dispatch logic then looks for a XVE with free thread slots and launches the hit/miss shader. Each hit/miss shader does whatever lighting and color calculations it needs to, hands control back to the RTA, and exits. Exiting is mandatory, because otherwise the thread would continue to occupy scheduler slots and may block the Xe Core’s dispatch logic when it tries to launch new hit/miss shaders.
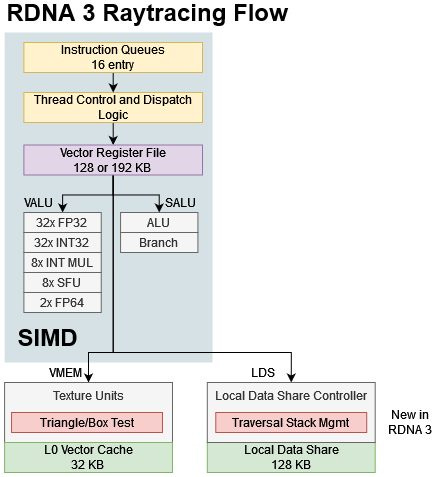
AMD’s RDNA 3 in contrast prefers to handle a ray entirely within a single shader program. Unlike on Intel, the RDNA 3 raytracing shader performs both BVH traversal and hit/miss handling, with certain steps accelerated by fixed function hardware. A shader program sends a BVH node address and ray data to the texture units, which does intersection tests. The Local Data Share, or LDS, can offload traversal stack management by pushing multiple node pointers and updating the stack pointer with a single instruction. Instead of terminating after talking to RT hardware, RDNA 3 raytracing shaders wait on the texture units or LDS just like they would for regular memory accesses.
Like Intel, AMD has stateless raytracing acceleration hardware. Shader programs give them all the info they need to carry out whatever they accelerate, and the accelerators don’t “remember” anything after they send results back.
DXR 1.0 and DXR 1.1
Intel’s raytracing flow closely corresponds to the DirectX Raytracing (DXR) 1.0 API, where DispatchRays takes call tables to handle ray hit/miss results. AMD’s flow lines up better with DXR 1.1’s RayQuery call, which performs ray traversal without invoking separate shader programs to handle results. DXR 1.1’s new RayQuery call is also known as inline raytracing.
Of course Intel can handle RayQueries too, and does so by skipping the thread sorting stage3. The thread sorting unit relies on being able to dispatch new shader programs, and quickly returning results to the same shader program doesn’t align with that. AMD can also handle DXR 1.0 raytracing by doing function calls with the s_swappc_b64 instruction. Function calls involve extra prologue/epilogue instructions to save and restore register state. A function call could also incur significant latency because GPUs don’t do branch prediction. AMD’s driver will often transform DXR 1.0 DispatchRays calls into an inlined form.
Traversal Algorithm
Internally the RTA uses a 4 entry stack, which is too short to capture all pending paths as the RTA follows a ray to the bottom of the BVH. Instead of using a classic depth first search, Xe-LPG uses a restart trail that indicates how many children have been visited at each level of the tree. The RTA can restart BVH traversal from the BVH root node, and check the restart trail to avoid re-visiting paths it has already covered. Restarting traversal from the top could cause upper level BVH nodes to get re-traversed a lot, which is where the “short stack” comes in. By saving some restart points, the “short stack” can let the RTA opportunistically avoid restarting traversal all the way from the top of the tree.
Each stack entry is 40 bits, and the restart trail has 29 3-bit entries1. Because traversal state occupies less than 16 bytes, the RTA can keep all of it within internal registers. AMD in contrast appears to use a depth first search, with the traversal stack stored in the Local Data Share (LDS). The LDS is directly addressed scratchpad memory local to each WGP, and does offer low latency compared to the L0 vector caches. However, LDS latency is still worse than register latency.
Intel is making a tradeoff where they potentially take more traversal steps, but can do very fast bookkeeping as they do so. Their research paper suggests a four-deep stack is enough for Intel’s algorithm to use just 16% more traversal steps than a conventional depth first search2.

Even with the new LDS instruction, RDNA 3 can struggle to hide LDS latency. A Cyberpunk 2077 path tracing shader for example spent 46 cycles waiting for traversal stack management. The SIMD was able to find independent ALU instructions from other threads and hide 10 cycles, but had to spend the rest of those cycles idling. Intel’s short stack and restart trail could reduce that latency because registers can typically be accessed an order of magnitude faster. That could more than compensate for having to take additional traversal steps compared to AMD.
Example: Cyberpunk 2077
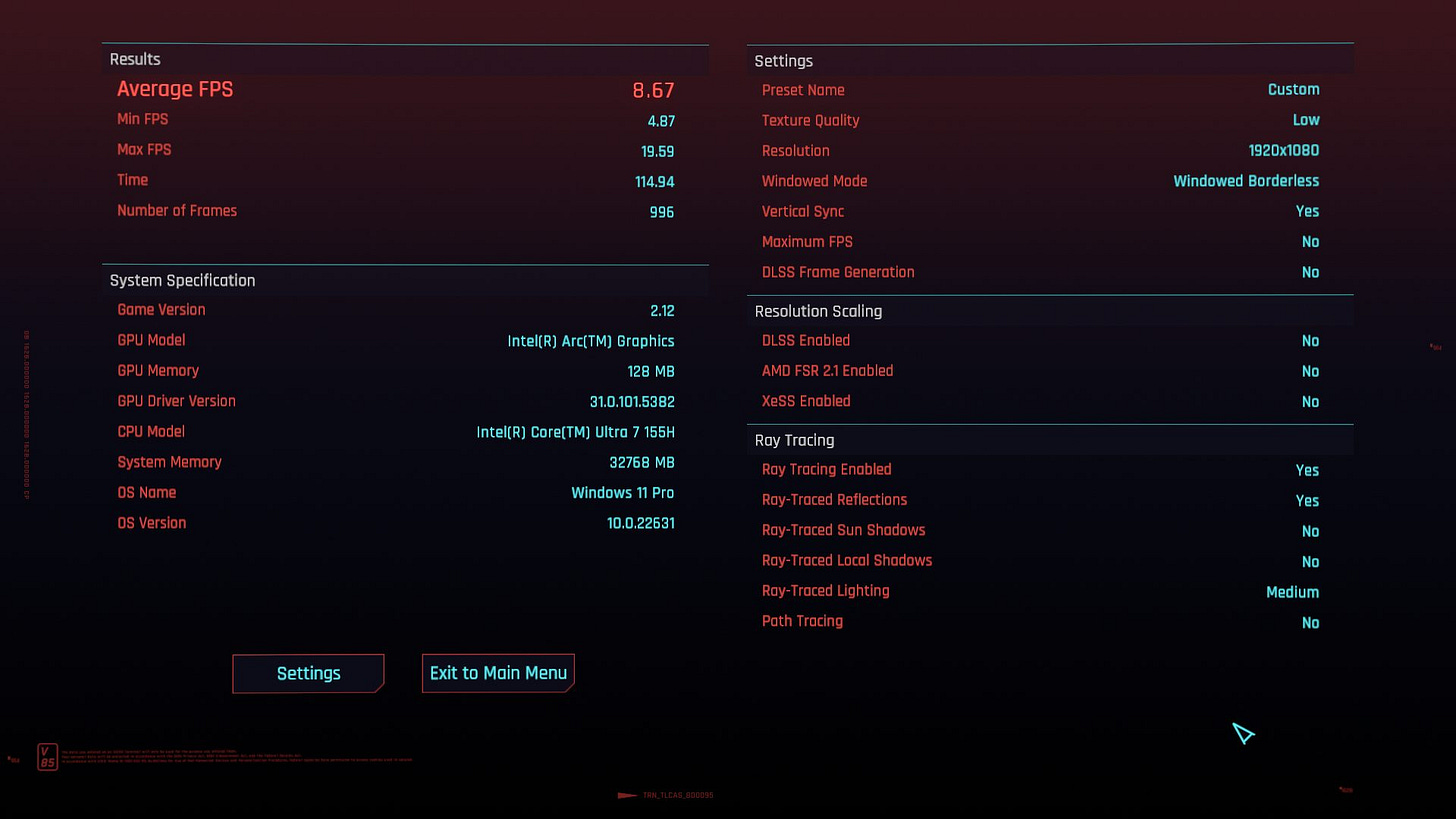
Cyberpunk 2077 makes extensive use of raytracing for reflections and shadows. Here I’m profiling a frame rendered at the Asus Zenbook 14’s native 2880×1800 resolution, with XeSS upscaling from probably 1440×900. I enabled raytraced reflections and set raytraced lighting to medium. The profiled frame took 146.4 ms to render, which is good for 7 FPS.
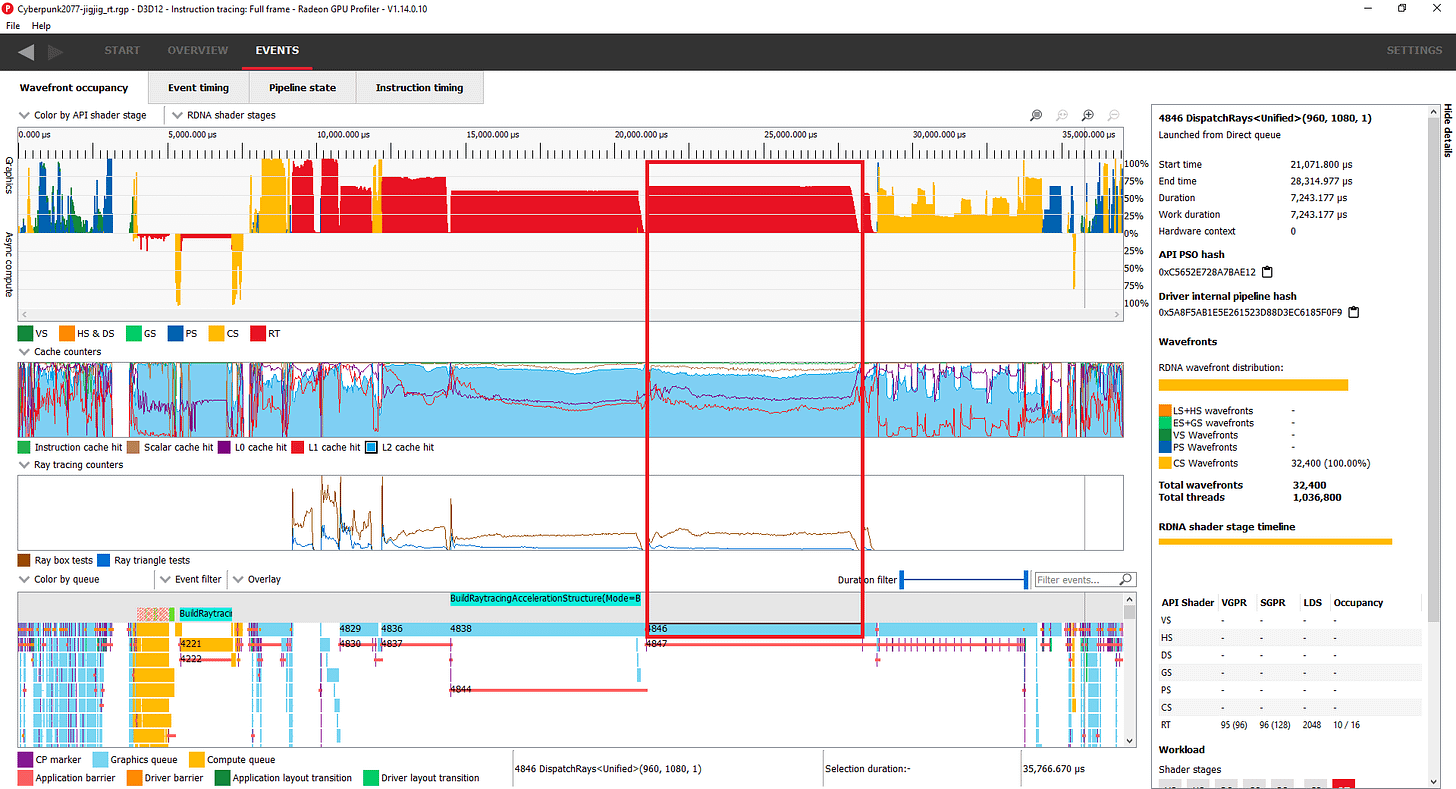
Raytracing occupies a huge chunk of frame time. GPA displays these sections in light red, and I’ve selected a section (orange-ish) that appears to be doing raytraced lighting.
Occupancy indicates how much thread level parallelism a GPU is tracking. A CPU core with two SMT threads running a single threaded program would be running at 50% occupancy, and the same concept applies to a GPU. Xe-LPG sees low occupancy over the longest duration raytracing calls. That’s how things are supposed to work. The XVEs aren’t running shader programs while the RTA does ray traversal.
RDNA 2 is a different story. Occupancy is high and only limited by vector register file capacity when raytracing. That’s because RDNA 2 shader programs stay active throughout the raytracing process. As on Meteor Lake, raytracing takes up a substantial portion of frame time.
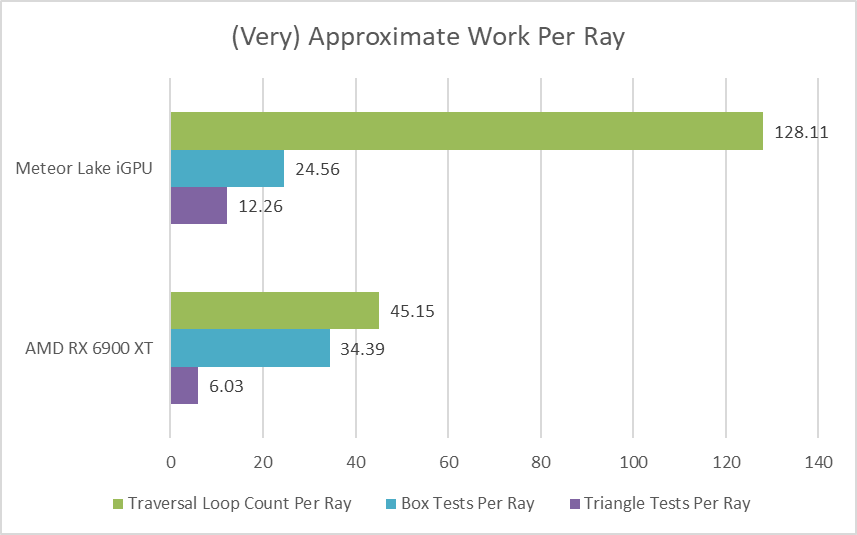
Lining up the same scene is hard and Intel’s Graphics Performance Analyzer sometimes faces issues playing back captures especially in DX12 mode. Comparing metrics is hard too. With that in mind, Meteor Lake appears to do take more traversal steps on average per ray. Perhaps it’s restarting traversal from the BVH root node quite often.
AMD uses fewer traversal steps on average, but ends up performing more box tests. i wonder if AMD and Intel are counting box tests differently. For example, AMD might be counting four box tests for each box node, even if not all four boxes exist. Traversal numbers above are an average too. You can occasionally get a “troll” ray that passes by a lot of geometry, resulting in very high traversal step counts.
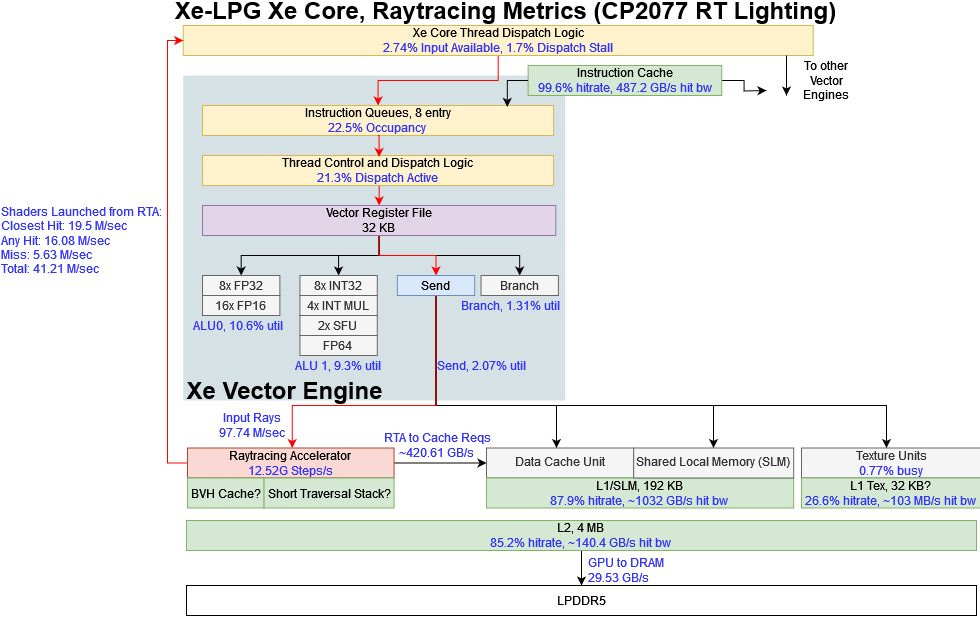
When handling raytracing, Meteor Lake’s general purpose shader execution units are mostly idle as a lot of work is offloaded to the raytracing accelerator. Xe-LPG’s raytracing scheme involves massive bandwidth as the RTA and general purpose shaders exchange data through the cache hierarchy. But much of that is kept within the Xe Cores, keeping pressure off the slower L2 cache and LPDDR5 memory subsystem. MTL’s large, high bandwidth 192 KB L1 caches do a beautiful job, servicing over 1 TB/s of requests across the GPU. The raytracing accelerators generate a substantial portion of that traffic.
Even though Intel’s big L1 enjoys an excellent 87.9% hitrate, the L2 still serves an important role because 151 GB/s of L1 miss traffic would far exceed theoretical LPDDR5 bandwidth. Meteor Lake’s 4 MB L2 has enough capacity to catch the vast majority of L1 misses, keeping LPDDR5 bandwidth demand under control.
Besides high bandwidth, Intel needs fast thread creation to take full advantage of their RTA. Each Xe Core has its own thread dispatcher, which can be fast and simple because it’s positioned close to the XVEs and only has to do bookkeeping for resources within a Xe Core. Intel’s RTAs launched over 41 million shader programs per second to handle ray traversal results, and the Xe Core thread dispatchers only had input waiting to be processed less than 3% of the time.
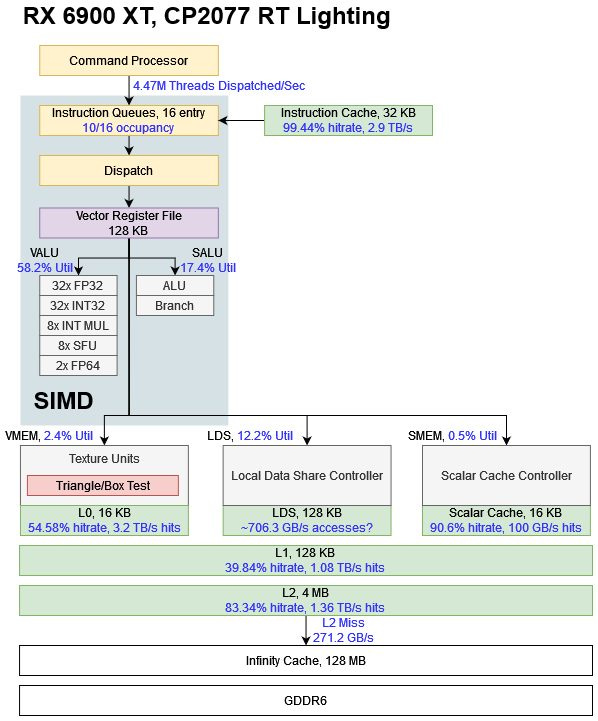
AMD doesn’t have per-WGP thread creation hardware, and has to launch threads at least at the Shader Array subdivision. That’s not a problem for AMD because RDNA 2 doesn’t start new threads to handle traversal results, even when doing DXR 1.0 raytracing. Therefore the RX 6900 XT needs an order of magnitude fewer shader program launches, even when raytracing at a higher internal resolution.
RDNA 2 sees high utilization on its general purpose shader execution units, with the vector ALU pipe active more often than not. That’s because the shader program has to oversee much of the raytracing process.
AMD’s cache hierarchy also handles mind-boggling amounts of bandwidth, but can’t keep as much of that traffic within the WGPs. RDNA 2’s 16 KB L0 caches get high enough hitrate to avoid pegging the mid-level 128 KB L1 caches, but not much more. Intel’s large L1 basically serves the role of both AMD’s L0 and L1 caches. Each RDNA 2 WGP does have a large 128 KB Local Data Share that sees substantial bandwidth. But that’s used for traversal bookkeeping, which Intel largely handles within the RTA.
The RX 6900 XT’s 4 MB L2 serves the same role as Meteor Lake’s, and catches the vast majority of miss traffic from upper level caches. 271 GB/s of L2 miss traffic is still a lot, but the 6900 XT is a much bigger GPU with a 128 MB cache after L2, and 512 GB/s of GDDR6 bandwidth on tap after that.
Example: 3DMark Port Royal
3DMark’s Port Royal is a raytracing focused benchmark. Unlike a real game, the benchmark takes place within a limited area and focuses on intense raytracing effects. I captured a 2560×1440 frame from the benchmark, which took 128.2 ms to render (or 8 FPS).
Like Cyberpunk 2077, Port Royal spends a lot of frame time doing raytracing. But after that, it spends even more time in compute shaders (purple). I’ll be focusing on the last raytracing call. It sees higher occupancy than the Cyberpunk 2077 RT call I looked at earlier.
I can also tell the call has something to do with glass reflections by looking at its outputs from Intel’s Graphics Performance Analyzer:
There is a longer duration RT call before it, but that one casts 3 million rays and outputs a 20×11 depth buffer. It makes no sense and I don’t want to think about it.
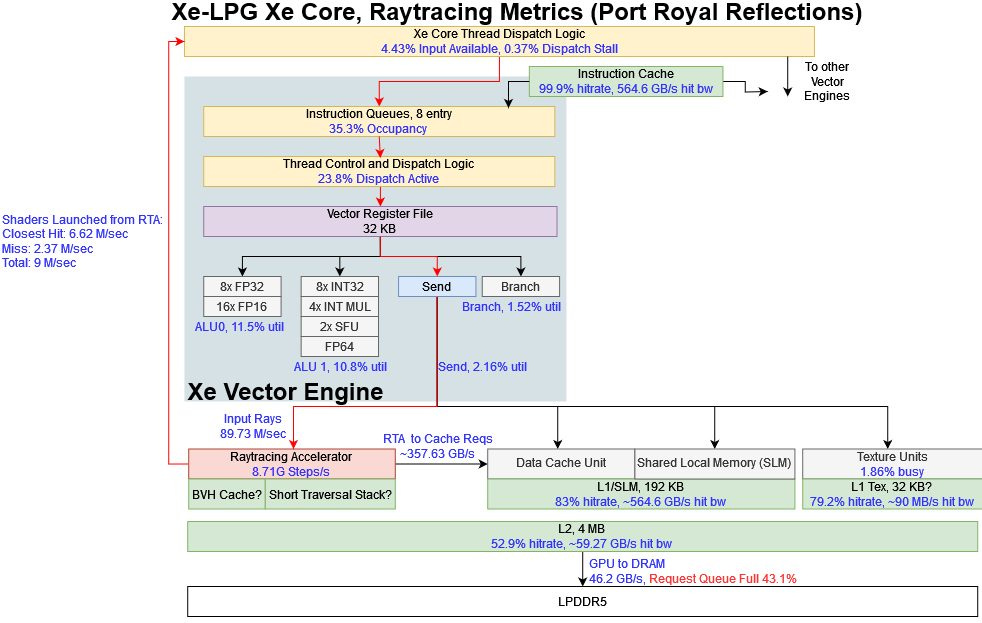
Again the XVEs see relatively low occupancy and little execution unit utilization because the RTA is taking care of the traversal process. L1 caches continue to do well, servicing 564.6 GB/s of bandwidth demands within the Xe Cores. However the 4 MB L2 doesn’t do as well as before, resulting in higher LPDDR5 traffic.
46.2 GB/s should be fine, since a GPU bandwidth test was able to sustain over 88 GB/s from LPDDR5. However, Intel’s Graphics Performance Analyzer indicated that the GPU’s memory request queue was full 43.1% of the time. That means the queue isn’t large enough to smooth out spikes in memory bandwidth demand, and we’re therefore looking at a mild DRAM bandwidth bottleneck. Intel could make the memory request queue longer, but even a longer queue will quickly fill if bandwidth demands don’t subside. Alternatively, Intel could use bigger caches or a wider memory bus. But that would require more die area or make the product more expensive.
This Port Royal raytracing call only has closest hit and miss shaders, likely because reflections don’t need to account for rays passing through geometry. Showing whatever it hits first is good enough. Intel GPA was unable to show the shader execution table for Cyperbunk 2077’s lighting-related DispatchRays call, but I suspect this Port Royal call sees higher occupancy because shader code spends more time generating rays and handling hits. Each individual shader program achieves high occupancy, which is expected because occupancy on Intel GPUs isn’t limited by register file capacity as on AMD/NV GPUs.
On that note, Intel still has some software work to do on their profiling tools. Their Graphics Performance Analyzer is an amazing program, but has a blind spot around raytracing. It can only show and profile assembly code for the ray generation shader, but not any of the miss or hit shaders. In the Port Royal situation above, the closest hit shader accounts for a significant portion of shader execution time. Insights on that would be very nice. Something like AMD’s Radeon Raytracing Analyzer would also be great.
RDNA 2’s cache hierarchy performs surprisingly well on this Port Royal DispatchRays call. L0 hitrate is staggeringly high, containing the vast majority of bandwidth demands within the WGPs. Of course the tiny L0 caches can’t contain everything, and a few hundred GB/s does leak out. The L1 and L2 caches do a miserable job of catching L0 misses. Perhaps Port Royal has a large memory footprint of occasionally accessed data that a 4 MB L2 isn’t big enough to catch. For those accesses, the 6900 XT’s bigger memory subsystem should avoid memory bandwidth bottlenecks.
Previously we saw Intel’s thread distribution hardware launching tons of shader programs to handle raytracing. With Port Royal, it’s AMD’s turn to spam-launch threads. With each thread running for an average of just 7.9 microseconds, the RX 6900 XT’s command processor launched a new thread every 12-13 clocks. That doesn’t mean an Intel-like raytracing scheme would neatly fit into RDNA’s architecture though. Even if RDNA 2 can launch a lot of threads, a trip across the GPU to reach work distribution hardware could incur too much latency.
Still, RDNA 2 turns in an impressive performance for having minimal hardware raytracing acceleration. Having a strong cache hierarchy is just as important as optimizing your execution units.
Final Words
Meteor Lake’s hardware raytracing offloads large portions of the ray traversal process to fixed function hardware. Intel’s approach contrasts with AMD’s RDNA 2/3, which offload certain expensive parts of the raytracing process but otherwise heavily leverage their general purpose shader execution units. Meteor Lake’s Xe-LPG architecture supports its raytracing acceleration units with fast dispatch hardware and large, high bandwidth L1 caches. It’s a showcase of how Intel can combine its potent engineering resources and existing designs to fight for feature parity with more established GPU players like AMD and Nvidia.
Nvidia’s raytracing scheme probably has more in common with Intel’s than AMD’s. Nvidia says Turing RT cores autonomously handle BVH traversal, but other low level details aren’t documented.
Personal Thoughts
Intel’s raytracing implementation is both interesting to analyze and technically impressive. But even if Intel can throw more transistors, area, and engineering hours at raytracing than AMD, I see little advantage for a product like Meteor Lake. Raytracing provides a bit of extra eye candy at massive performance cost. Like extreme tessellation effects from the early 2010s, enabling raytracing only makes sense if you can already achieve high baseline performance. Then, you can trade some framerate for extra effects.
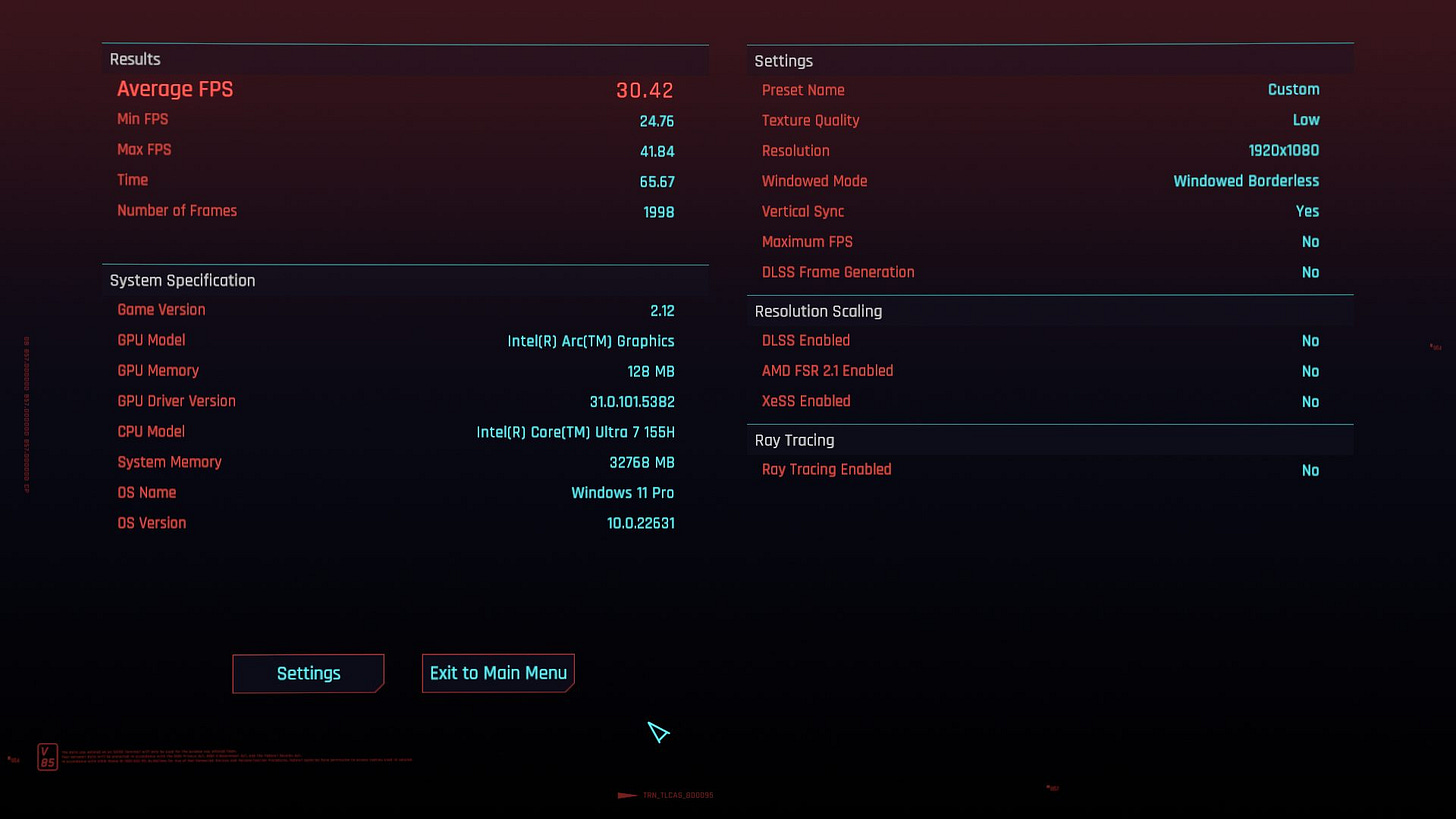
iGPUs like Meteor Lake’s already have to sacrifice resolution and quality settings to approach 30 FPS without raytracing. They don’t have the framerate headroom for something as heavy as real time raytracing.
In my opinion, raytracing only starts to make sense with a midrange discrete card like an RX 6700 XT or RTX 3070. Those cards occupy a difference price and power segment than Meteor Lake’s iGPU. Even with such a card, picking between 80-90 FPS without raytracing or 25-47 FPS with raytracing is not a straightforward choice. If a game has enough fast paced shooting sequences, I’d take higher framerate over extra eye candy.
Matrix multiplication units are conspicuously missing from the features Meteor Lake’s iGPU inherits from Intel’s higher end discrete cards. I think having these “XMX” units would provide more value than hardware raytracing. Better upscaling could help get more games to playable framerates without lowering resolution or dropping settings to low. But I don’t know how much area and power the XMX units require. Perhaps XMX units were too area and power hungry, but RT acceleration was relatively cheap. Who knows.
If you like our articles and journalism, and you want to support us in our endeavors, then consider heading over to our Patreon or our PayPal if you want to toss a few bucks our way. If you would like to talk with the Chips and Cheese staff and the people behind the scenes, then consider joining our Discord.


