
Microbenchmarking Nvidia’s RTX 4090

Nvidia’s RTX 4090 features Nvidia’s newest architecture, named Ada Lovelace after a pioneer in early computing. Compared to their previous architecture, Ampere, Ada Lovelace enjoys a process node advantage, with a TSMC 4 nm process customized for GPUs. Nvidia has also emphasized raytracing performance, as well as technologies meant to compensate for the massive performance hit from enabling raytracing. We’ve covered that in a previous article. But raytracing performance isn’t the only thing that matters, because there are plenty of games that don’t support raytracing at all. Also, most games that use raytracing only use it to render certain effects; traditional rasterization is still responsible for rendering most of the scene.
I also feel that the focus on raytracing overshadows what Nvidia’s engineers have done to improve performance in other areas. In this article, we’re going to look at Nvidia’s Ada Lovelace architecture, using a set of work-in-progress microbenchmarks. We’ll focus on areas that impact performance in all kinds of workloads, raytracing or not, with special emphasis on the cache and memory subsystem.
Special thanks to Skyjuice for running the tests on a RTX 4090.
GPU Overview
SMs, or Streaming Multiprocessors, form the basic building block of Nvidia’s GPUs. They’re roughly comparable to WGPs, or Workgroup Processors, on AMD’s RDNA and RDNA 2 architectures. SMs and WGPs both feature 128 FP32 lanes (or shaders, if you will), and are further divided into four blocks with 32 lanes each. Ampere’s largest client die, GA102, is already massive.
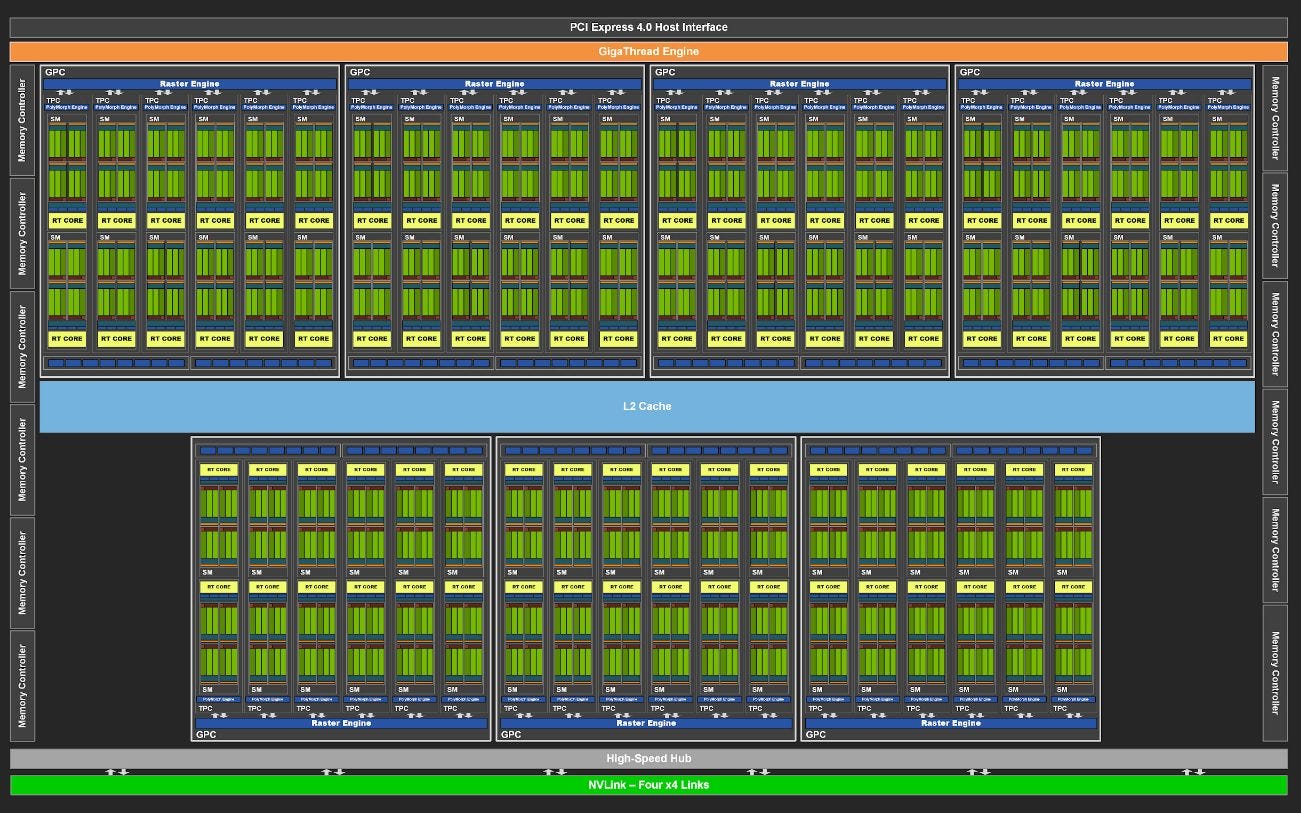
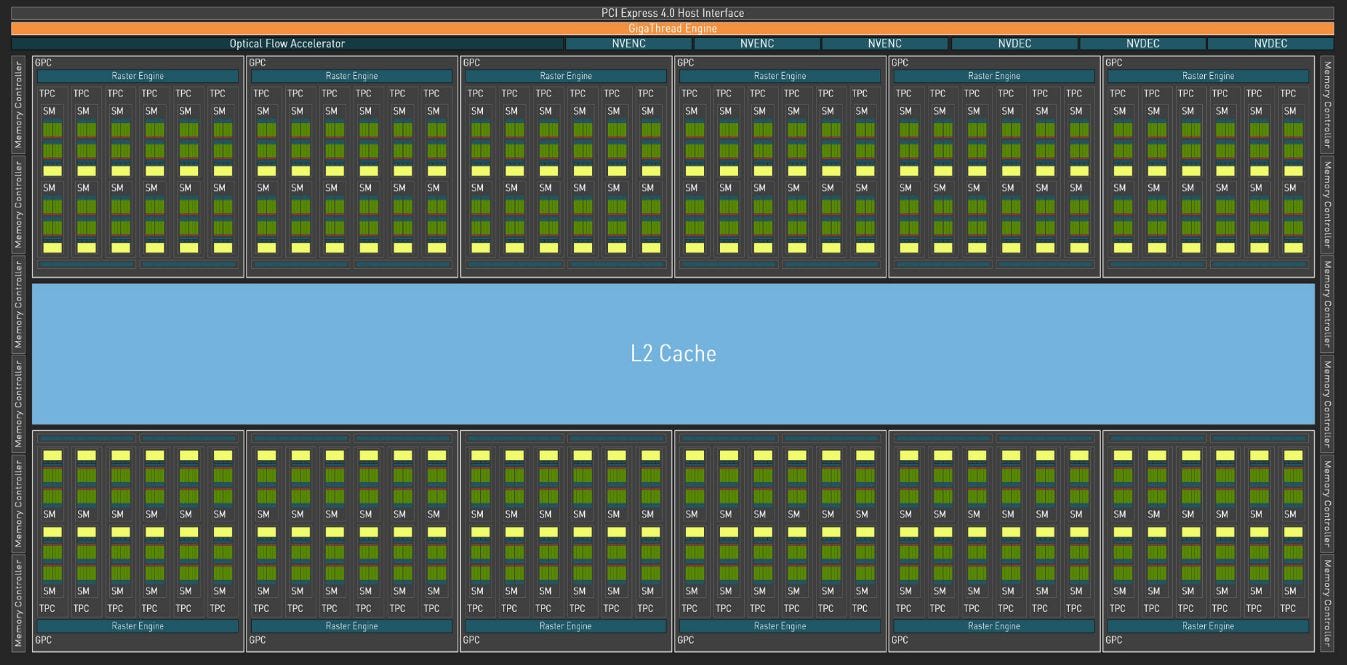
Ada Lovelace is superficially similar to Ampere, with similar compute characteristics for each SM. However, it has been scaled up through the roof. AD102 has 144 SMs, compared to 84 on GA102, representing a 71% increase in SM count. The RTX 4090 only has 128 SMs enabled, but that still represents a 52% increase. Combine that with a large clock speed bump, and we’re looking at a massive jump in compute power.
But scaling up a GPU is much more than a copy and paste job. GPUs tend to demand a lot of bandwidth from the memory subsystem, and all those extra SMs have to be fed somehow. Let’s turn to our set of work-in-progress microbenchmarks to have a look at Ada Lovelace’s memory hierarchy.
Cache and Memory Latency
We’re starting a cache and memory latency benchmark, because that will give us a good idea of the cache setup. Like Ampere, Ada Lovelace sticks with a tried and true two-level caching scheme. Both of Nvidia’s recent architectures have a large L1 cache private to each SM, but Ada Lovelace substantially expands the L2 cache. Ampere had a conventionally sized 6 MB L2, but AD102 packs 96 MB of L2. The RTX 4090 has 72 MB of that L2 cache enabled. Nvidia didn’t enjoy a significant VRAM bandwidth increase going from Ampere to Ada Lovelace, so Ada’s L2 received a massive capacity boost to prevent memory bandwidth bottlenecks as compute capacity gets scaled up.
AMD’s RDNA 2 architecture opts for a complex four-level caching system, with three levels of shared cache. There’s a 128 KB L1 in each shader array to absorb cache miss traffic from the relatively small (16KB) L0 caches. The L2 has a comparable role to Ampere’s L2, while the large Infinity Cache helps AMD achieve high performance with a less expensive (and less power hungry) VRAM subsystem.

Ada Lovelace’s cache subsystem enjoys impressive latency characteristics. The first level, SM-private cache looks similar to Ampere’s, though Ada Lovelace’s higher clock speeds give it an overall latency advantage. But L2 is where the fun starts. Despite a gigantic 12x capacity increase over Ampere’s L2, Nvidia has managed to bring latency down by roughly 30 ns. Ampere’s L2 was close to AMD’s Infinity Cache in terms of latency, but Ada Lovelace’s L2 now lands right between RDNA2’s L2 and Infinity Cache in terms of both capacity and latency.
Against Ampere, RDNA 2’s cache subsystem looked very competitive. The two trade blows at small test sizes, while AMD has a clear advantage in L2 sized regions and beyond. Ada Lovelace changes this, and Nvidia now enjoys a clear advantage as test sizes spill out of AMD’s L2. Memory latency has dropped in Ada Lovelace as well, though this may be due in large part to better L2 performance, since the L2 has to be checked on the way to memory.
With Ada Lovelace’s improved L2, AMD finds themselves in an uncomfortable position where Nvidia is using a single level of cache to fill the roles of both AMD’s L2 and Infinity Cache. Fewer cache levels mean lower complexity, and fewer potential tag and status checks for each memory access. Of course, more cache levels mean more flexibility in making capacity, latency, and bandwidth tradeoffs. RDNA 2 certainly demonstrated that against Ampere, with a much faster L2 cache and a much larger Infinity Cache that was almost as fast as Ampere’s L2. But Ada Lovelace is a different story.
Bandwidth
Latency is a factor in GPU performance, but bandwidth is also a factor, and GPUs tend to be a lot more bandwidth hungry than CPUs. To start, we’re going to test bandwidth with a single OpenCL workgroup. Threads belonging to the same workgroup are able to share local memory, which means they’ll be restricted to running on a single WGP or SM. This is the closest we can get to a GPU single core bandwidth test.

A RDNA 2 WGP enjoys a good bandwidth advantage over an Ampere SM once we get into L2 and beyond. Ada Lovelace doesn’t change that, but L2 bandwidth does improve over Ampere. Again, we see Nvidia’s engineers doing an amazing job on that L2. On AMD’s side we’re starting to see signs that RDNA 2 is very good at dealing with low occupancy workloads. Let’s increase the workgroup count to test scaling, and see how long that advantage holds.
Bandwidth Scaling
Shared cache design is hard especially in GPUs, because the cache has to be connected to a lot of clients and meet their bandwidth demands. Here, we’re testing bandwidth with increasing numbers of workgroups in play. As before, each workgroup has to go to a single WGP or SM, so we’re seeing how well the shared cache can cope as more WGPs and SMs come into play and start demanding bandwidth.
Ada Lovelace is a clear improvement over Ampere, and achieves higher bandwidth at matched workgroup counts. With all the RTX 4090’s SMs in play, we see a staggering 5 TB/s of bandwidth – nearly double what we see with the RTX 3090’s 84 SMs. Nvidia has managed to scale up L2 capacity while also scaling up bandwidth to feed a massive number of SMs, which is quite an accomplishment. Ada Lovelace’s ability to outmatch Ampere at low occupancy is icing on the cake.

AMD still holds an advantage for small workloads. RDNA 2’s L2 is particularly impressive with scaling, and can handle 40 WGPs asking for maximum bandwidth without showing contention issues. The large Infinity Cache also does well, beating out Ampere and Ada Lovelace at low occupancy. But unlike what we saw with Intel’s Arc A770, Nvidia is not far behind.
More importantly, Ada Lovelace’s improved performance at low occupancy means RDNA 2 loses its advantage faster than it did against Ampere. With more than 24 workgroups in play, Ada Lovelace’s SMs can pull more bandwidth from L2 than RDNA 2’s WGPs can from Infinity Cache. RDNA 2’s L2 bandwidth advantage holds until Nvidia has more than 50 SMs in play. But a L2 comparison between RDNA 2 and Ada Lovelace is a lot less straightforward because L2 capacities are no longer in the same ballpark, as they were between RDNA 2 and Ampere. At high occupancy, Ampere had a decent advantage over RDNA 2, but Ada Lovelace takes it a step further. RDNA 2’s L2 and Infinity Cache are both at a clear disadvantage against Lovelace’s L2.
Next, let’s look at what happens when test sizes are large enough to spill out of cache.

Ada Lovelace doesn’t scale up as fast as Ampere, but that advantage isn’t particularly important because Ada Lovelace should be servicing a lot more memory accesses out of L2. VRAM bandwidth also hasn’t dramatically increased over Ampere, but both Nvidia cards still have a ton of bandwidth in absolute terms. For perspective, they have almost as much theoretical VRAM bandwidth as AMD’s Radeon VII, which has a HBM2 based VRAM subsystem.
AMD’s RDNA 2 again enjoys a bandwidth advantage at low occupancy, but Nvidia’s recent architectures have a lot more VRAM bandwidth on tap for large workloads. AMD is also more dependent on their Infinity Cache, as their VRAM bandwidth stops scaling after a dozen WGPs are loaded.
Finally, let’s test bandwidth at high occupancy with 512 workgroups in play. That should give each SM or WGP multiple workgroups to play with, with plenty of parallelism exposed in each workgroup.

Ada Lovelace’s L1 bandwidth goes through the roof and destroys the scale on this graph for everyone else, thanks to the RTX 4090’s high clock speeds and insane SM count. L2 cache bandwidth is no joke either, and a solid improvement over Ampere’s. RDNA 2 is left struggling to compete even when it can service memory accesses from L2 or Infinity Cache. AMD really has their work cut out for them.
Local Memory Latency
On GPUs, local memory is a small block of scratchpad memory, shared by all threads in a workgroup and not accessible outside the workgroup. Software has to explicitly load data into local memory, and local memory contents are gone once a workgroup finishes execution. That makes local memory more difficult to use, but in exchange, local memory typically offers faster and more consistent performance than the normal global memory subsystem. One use of local memory is to store a BVH traversal stack when raytracing.
Nvidia calls local memory “shared memory”, while AMD calls it the “local data share”, or LDS.

Ada Lovelace provides a decent improvement in local memory latency over Ampere, extending Nvidia’s lead over RDNA 2. A small caveat here is that both of Nvidia’s architectures use a single 128 KB block of SRAM to serve as both L1 cache and local memory. The architecture can provide different combinations of L1 cache and local memory sizes by varying how much of that SRAM is tagged. AMD in contrast uses 16 KB of dedicated L0 vector cache for each CU (half of a WGP), and a dedicated 128 KB of local memory. That means Nvidia will have less local memory capacity available in practice.
Compute
Trying to determine per-cycle, per-WGP throughput figures is an exercise in frustration, because it’s hard to determine what clock speed the GPU ran at. We also need to look into whether Nvidia’s Ampere and Ada Lovelace architectures are doing something weird with our instruction rate tests, which is hard because I (clam) don’t own either.
At least as far as we can tell, Ada Lovelace performs a lot like Ampere. Latency for common FP32 operations like addition and fused multiply add remain at 4 cycles. RDNA 2 for comparison has 5 cycle latency for those operations.
To summarize throughput characteristics for various types of operations:
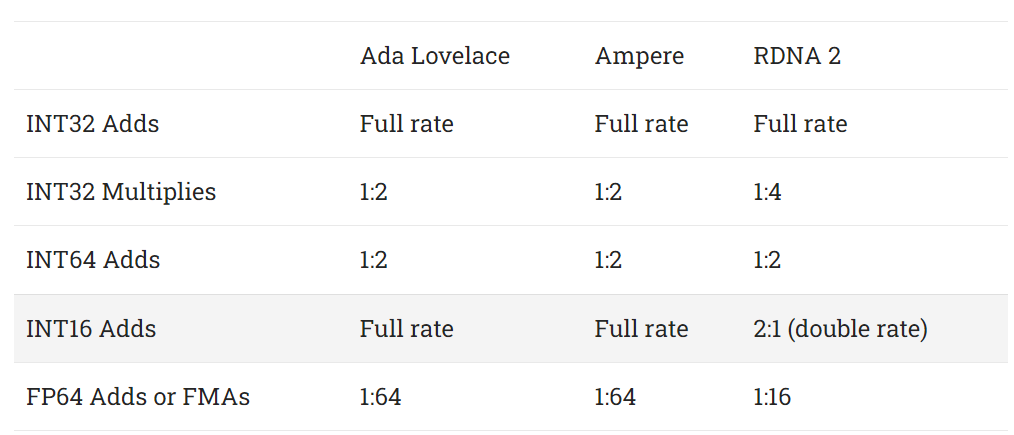
RDNA 2 also executes FP16 operations at double rate. According to the Ada whitepaper, Ampere and Ada Lovelace can do FP16 at 1:1 rate, but we were unable to verify this because neither of the Nvidia cards support the FP16 extension for OpenCL.
Atomics Latency
Much like CPUs, modern GPUs support atomic operations to allow synchronization between threads. OpenCL exposes these atomic operations via the atomic_cmpxchg intrinsic. This is the closest we can get to a core to core latency test on GPUs. Is it relevant to gaming? Probably not, as I’ve never seen these instructions used in game shader code. But is it fun to test? Yes.
Unlike CPUs, GPUs have different atomic instructions to deal with local and global memory. Atomics on local memory (shared memory or LDS) should be completely contained within a SM or WGP, and therefore should be much faster than atomics on global memory. If we wanted to stretch things a bit, atomics latency on local memory is roughly comparable to measuring core to core latency between sibling SMT threads on a CPU core.

Ada Lovelace delivers an incremental improvement over Ampere here, probably due in large part to higher clock speeds. AMD’s RDNA 2 performs very well in this test. In an absolute sense, it’s interesting how “core to core” latencies on GPUs are comparable to cross-CCX accesses on Ryzen CPUs.
Final Words
Nvidia’s new Ada Lovelace architecture got a lot of attention for its increased raytracing performance and ability to rapidly hallucinate intermediate frames. That’s understandable, because Nvidia spent most of their keynote talking up those features. And that in turn is understandable, because otherwise there aren’t a lot of changes to Nvidia’s basic compute architecture.
But Ada Lovelace’s improved cache architecture deserves a lot of attention. AD102’s L2 cache implementation is dramatically improved over GA102’s. Obviously, it tackles the memory bandwidth problem by increasing L2 cache capacity, almost to AMD Infinity Cache levels. The amazing part is that Nvidia has done this while also improving L2 cache performance compared to GA102. AD102’s L2 has more bandwidth, allowing it to feed the additional compute capacity. It has reduced latency, making it easier to utilize the available bandwidth. Better L2 latency indirectly reduces VRAM latency as well, because a significant portion of VRAM access latency is just moving data across the GPU die. Ada Lovelace does that faster. And of course, AD102 should have to hit VRAM less often than GA102.
Beyond global memory subsystem changes, Ada Lovelace also improves local memory latency. Compute throughput at low occupancy takes a step forward compared to Ampere too, thanks to much higher clock speeds. Clock speed increases may be boring, but higher clock speeds are a very good way of scaling performance, and mean that just about everything you can do on Ampere can be done a bit faster on Ada Lovelace.
All of changes come together to make Ada Lovelace a formidable architecture, even if we put aside the headline grabbing raytracing related features. Nvidia’s new architecture improves performance at low occupancy, eroding one of RDNA 2’s key advantages over GA102. At high occupancy, Ampere was already very strong. Ada Lovelace extends that strength, and towers over RDNA 2. AMD has their work cut out for them if they want RDNA 3 to be competitive, even in pure rasterization workloads. We look forward to seeing what AMD’s next architecture will bring.
If you like our articles and journalism and you want to support us in our endeavors then consider heading over to our Patreon or our PayPal if you want to toss a few bucks our way or if you would like to talk with the Chips and Cheese staff and the people behind the scenes then consider joining our Discord.