
Measuring Zen 3’s Bottlenecks

Zen 3 is one of the fastest CPU cores currently on the market; that isn’t up for debate.
However, even the fastest CPU cores have bottlenecks and today we are talking about the bottlenecks that Zen 3 has and what AMD could improve with Zen 4.
We gathered far too much data from Cinebench R23, Civilization VI, 3DMark Timespy, War Thunder, Europa Universalis IV (EU4), and Linpack. To keep the article at a readable length, only select charts will be shown. However, there will be a link in the appendix to all the data.
Starting from the Middle
We’ll start our journey at Zen 3’s rename and allocate stage. This 6-wide stage sits right between the in-order frontend (responsible for feeding the core with instructions) and the out-of-order backend (which executes instructions). That makes it a rather convenient place to get a look at how frontend and backend bound we are. Let’s look at both sides of the rename/allocate stage:
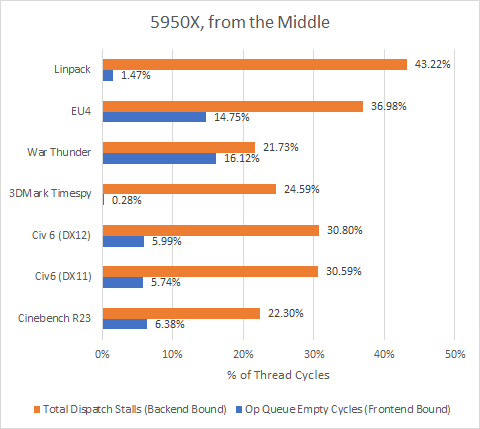
“Op Queue Empty” shows how often the decoder or op-cache was unable to keep decoded micro-ops queued up in front of the renamer. This is the best current metric for frontend stalls, because the micro-op queue is responsible for most micro-ops feeding into the backend. We could overestimate frontend bottlenecks if a group of micro-ops bypasses the micro-op queue, going directly from the decoders or op cache to the renamer. Alternatively, we could understimate frontend bottlenecks if micro-ops simply trickle into the op queue, keeping it from emptying but keeping the renamer under-fed. However, neither over or underestimation fits with the current data.
“Dispatch Stalls” shows how often the renamer had to pause because the backend couldn’t accept more instructions. In other words, that’s how backend bound Zen 3 is. There are actually two dispatch stall events on Zen 3, covering different reasons for the stall. We’re adding them here to present one metric, so the percentage shown above should be taken as a maximum because stall reasons can overlap.
Breaking down Backend Stalls with the Graph of Everything
In all of the tests here, Zen 3 is more backend bound than frontend bound. However, there’s still room for improvement in the frontend, as shown by War Thunder and EU4. For now, let’s start by looking at the backend, since that’s where the action is. Here’s a breakdown of why Zen 3’s out of order execution engine was unable to accept more instructions:
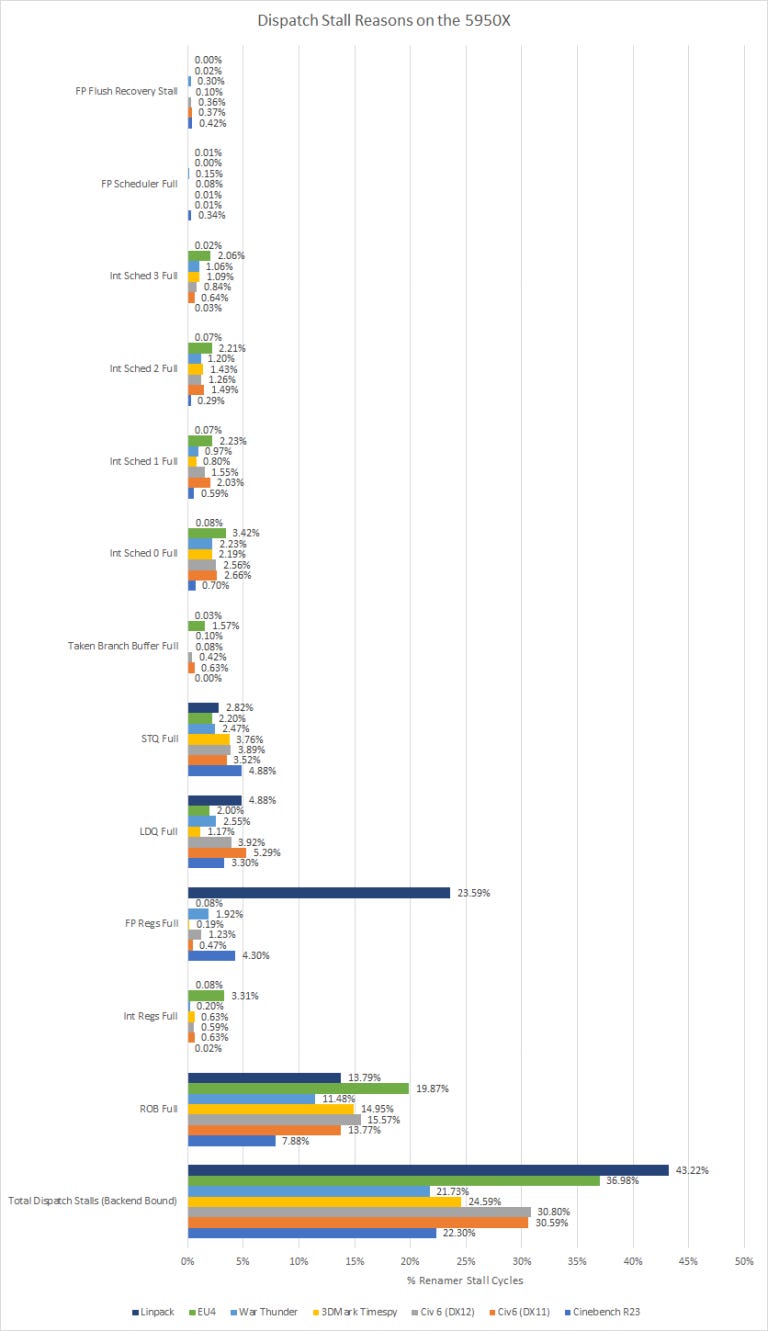
Zen 3’s backend contains various instruction tracking resources. Schedulers keep track of instructions waiting to execute, sending them to execution units once inputs are ready and the execution pipe is free. The reorder buffer (ROB) holds all instructions waiting for their results to be checked and committed. Any instruction that writes to a register needs an entry allocated in the appropriate register file. And as you might guess, instructions that read data from memory need an entry in the load queue (LDQ), and instructions that write data to memory need an entry in the store queue (STQ).
Now as a little bit of a side note, Zen 3’s processor programming reference lists two more stall reasons – Taken Branch Buffer Full, and FP Flush Recovery Stall. The taken branch buffer might be used to checkpoint global history, letting the CPU quickly correct branch predictor state if a mispredict is discovered. FP flush recovery stalls are even more mysterious, but they may have to do with floating point exceptions. We’re not entirely sure what these mean. But counts for both events are relatively low, so they’re not particularly important.
If the rename/allocate stage needs an entry in some resource that’s already full, you get a dispatch stall. As you can see from the data above both stalls due to the FP scheduler being full and the FPU recovering from a flush are a rare occurrence in all of the workloads we tested, however stalls due to the FPU’s register file being full is very common in Linpack which is no surprise because Linpack is a very FPU intensive workload. Evidently a lot of instructions in Linpack produce floating point results, and need corresponding entries allocated in the FP register file. Cinebench R23 took a distant second place in running out of FP register file entries, but it’s nowhere near as much as Linpack.
The Integer side of things is similar to the FP side of things where most of the workloads don’t get stalled on the schedulers or the register file with the notable exception of Europa Universalis IV stalling on the Integer Schedulers 2 to 3.5 percent of the time and on the Integer Register File a little more then 3% of the time.
In the load/store unit, the LDQ and STQ each roughly account for 2 to 5 percent of renamer stall cycles.
The Reorder Buffer (ROB) is the part of the core that allows ops to be executed out of order relative, by tracking the instructions in the original program order. The ROB being full is the most common reason for the core to stall, and is responsible for stalling the renamer about 8 to 20% of the time. In a way, that’s a good thing, because it means the core’s not stalling on other structures first. AMD has done a good job with profiling workloads and sizing Zen 3’s various OOO queues, so Zen 3 is quite often running into the limit of how many instructions it can keep in-flight.
Now the Taken Branches Buffer full and Op Queue empty are unique in that those two types of stalls are due to the frontend being the bottleneck where as all the previous reasons for a stall had to do with the backend being the bottleneck.
We think that Taken Branches Buffer full is being used to track history updates to the branch predictor, we will talk more about the Branch Predictor (BPU) later in this piece, and allows checkpointing of the global history of the BPU, and in our testing the worse result was from Europa Universalis IV at a fairly low 1.57% of stalls being caused by the Taken Branches Buffer being full.
Stalls caused by the Op Queue being empty was a fairly common occurrence with the worst cases being War Thunder and EU4 stalling out on the Op Queue 16.12% and 14.75% of the time respectfully with Civ6 (DX11), Civ6 (DX12), and 3DMark Timespy all being stalled roughly 6% of the time on the Op Queue.
All Things Branch Predictor Related
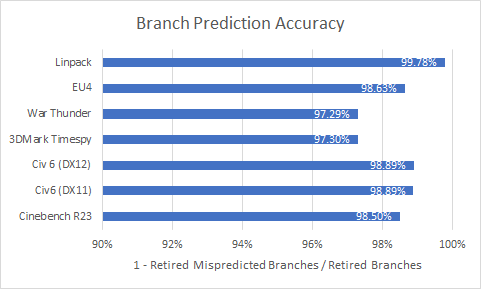
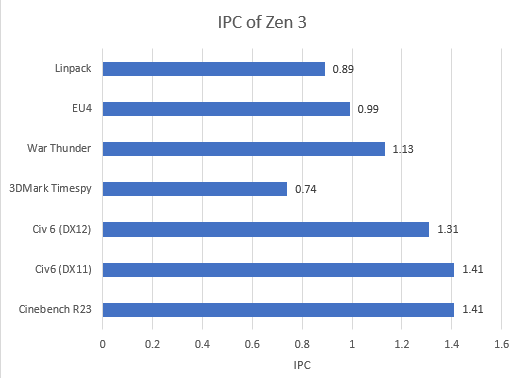
The Branch Predictor Unit (BPU) is arguably the most important part of a modern high performance CPU core. The BPU’s job is to predict which way a branch will go before it is definitively known. A basic example of this is if you have a if-then-else statement, the BPU will try and guess what the correct path is before the CPU has executed the instructions needed to be certain of the path that the branch will take. Having a high BPU accuracy rate is needed to keep the instruction pipeline flowing, which prevents stalls or flushes of the core so the higher the better and as we can see in the chart above, Zen 3’s BPU is very good with the lowest recorded hitrate being War Thunder at 97.29%.
But we can dive farther into the BPU and see what is happening internally.
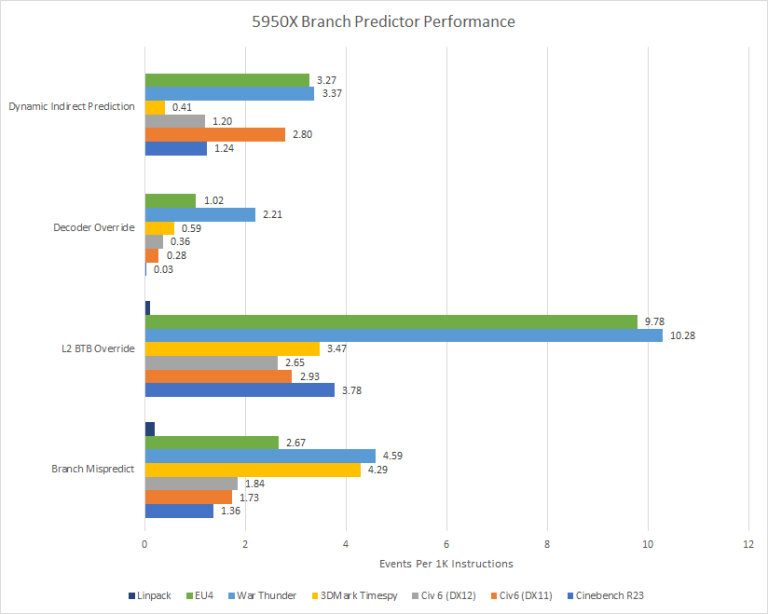
Starting from the bottom of this chart, branch mispredict is simply when the BPU picks the wrong path that a branch will go down. This isn’t a super common event with it occurring at worst less then .5% of the time for all executed instructions. That’s good, because mispredicts are expensive and waste power when the backend works on the wrong instructions only to flush them out.
The BPU doesn’t just have to predict branches correctly – it has to do it fast. Zen 3’s BPU has a two level cache of branch targets, called branch target buffers (BTBs). Using the L1 BTB, Zen 3 can do back to back predictions with no wasted cycles after a taken branch. The L2 BTB has 6656 entries and costs three frontend cycles (pipeline bubbles) if it’s used to provide a branch target. For branches that don’t go to the same address when taken, Zen 3 has an indirect target array with 1536 entries. Using that will incur a similar penalty to using the L2 BTB. Finally, if the branch doesn’t have its target cached by the BPU, the decoder will step in and calculate the target address. AMD’s optimization manual doesn’t talk about how many cycles that costs, but from our testing, it seems to be around 12 cycles.
With that in mind, let’s have a look at how well the branch predictor did:
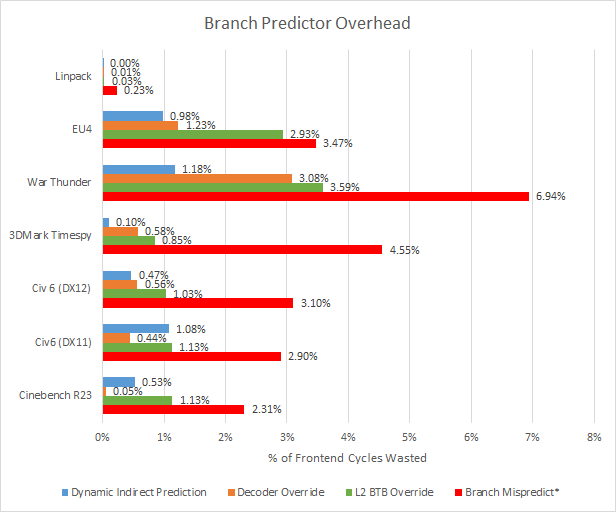
Even though Zen 3 has very good prediction accuracy, mispredicts are still a clear optimization target. Unlike L2 BTB/ITA/Decoder overrides, a mispredict will flush out previously fetched instructions, making the penalty much harder to hide. Incorrectly fetched instructions also use up backend resources. So the CPU is losing a lot more cycles from mispredicts than the graph above would suggest. Accurately predicting branches is a hard problem, but AMD has improved significantly in this area since the Bulldozer days and we’re sure they’ll continue to tweak it.
For branch predictor latency (not related to mispredicts), our graph likely overestimates the cost. Queues in the frontend can hide frontend cycles wasted by the branch predictor, especially if branch density isn’t too high and/or the core is primarily backend bound. Branch predictor overhead can matter in high IPC tasks bound by frontend bandwidth, but none of the applications tested here fall into that category.
Of course, AMD could also try to make the L2 BTB faster, or increase the size to avoid L2 BTB misses in cases like War Thunder. That might increase overall performance by a hair.
Another interesting observation is that the DX12 version of Civ6 uses Zen 3’s indirect target array less than the DX11 version.
Cache, Cache, Money
Cache is one of the primary techniques that CPU designers use to feed the backend of a CPU core. The more effective a cache layer is, the less burden is placed on the next layers of cache take for example, the better stocked your food pantry the less you have to go to the store.
Caching exists to keep the core fed with data and to keep the amount of instructions that the core is working as high as possible thus keeping the IPC high.
So the Op Cache’s job is to take pressure off the decoders and keep the instruction stream moving as efficiently as possible.
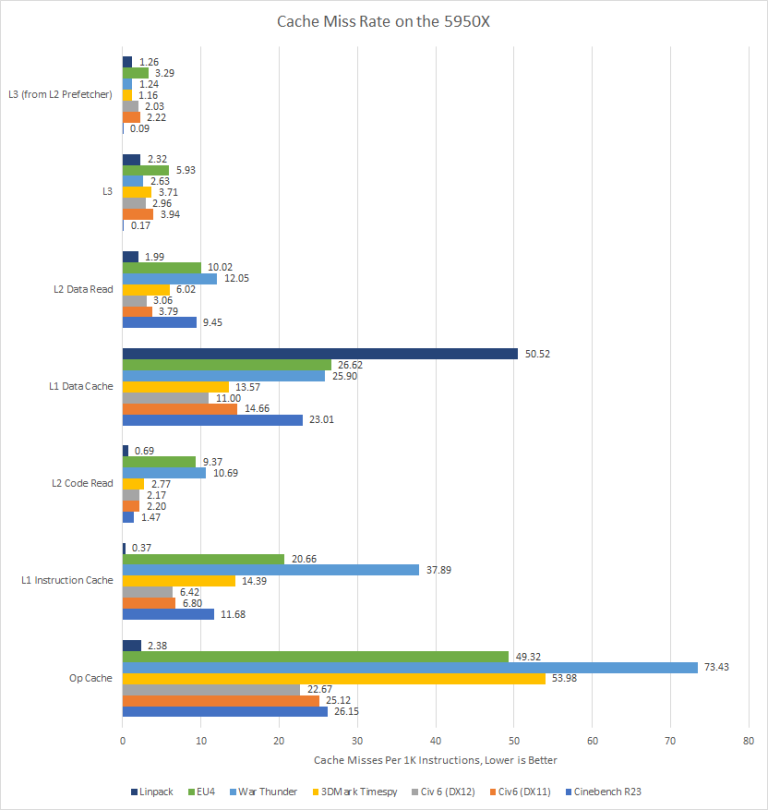
As we can see from the chart, War Thunder at 7.343% of the time missing the Op Cache has the highest miss rate of all the applications with 3DMark Timespy and EU4 at 2nd and 3rd place respectfully.
This suggests these 3 applications use the decoders quite often because the amount of instructions that are being streamed doesn’t fit into the 4K entry Op Cache that Zen 3 has where as Linpack’s instruction stream fits into the Op Cache.
Now the L1 in Zen 3 is configured in two 32KB blocks, one for the Data side (L1D) and the another is for the Instruction side (L1i). Missing the L1 Instruction cache can be covered up by the core if you are below 1 IPC like TimeSpy or Linpack but for an application like Cinebench or War Thunder where the IPC is over 1, high L1i miss rates are hard for the core to cover up.
Note: Decoder bandwidth is unlikely to be a factor in the applications we tested. There are 4 decoders in Zen 3 and we never exceeded 2 IPC in our testing. This suggests that adding more decoders would not improve performance significantly.
On the other hand, the core can not cover up high L1D miss rates and Linpack misses the L1D by almost twice the amount of any other tested application which means that about 5% of all instructions have to be fetched from a higher level cache which is slower then the L1.
Looking at War Thunder in particular, you have a lot of misses from both the L1i and L1d caches which is detrimental to performance. This is an area that can be improved in later architectures.
The L2 in Zen 3 is a unified block that can fit both data and instructions that the core is working on and as you can see for L2 code (instructions) the two applications with the highest miss rate are EU4 and War Thunder. The L2 data is similar with the noted addition of Cinebench having relatively high miss rates.
The L3 of Zen 3 has relatively low miss rates compared to the L1 and L2 caches which is to be expected. However, the less you have to go to main system memory which is a magnitude higher latency and several magnitudes less bandwidth then the L3, the better. This is why AMD is adding V-Cache to Zen 3 but only applications that miss the L3 a large amount, like games, will see large improvements from V-Cache.
What AMD may change with Zen 4
Now I am going to preface this section by saying that cutting edge CPUs are basically black voodoo magic that no single person could ever fully understand however, based on the gathered data we can draw some conclusions on what AMD may change in Zen 4.
The first thing AMD will almost certainly do is make the Branch Predictor better. Now Zen 3’s BPU is already very good, however the fewer cycles you waste on branch mispredicts or on L2 BTB overrides the more cycles you can do useful work.
The next thing AMD will try and improve with Zen 4 is the amount of dispatch stalls that the core has which can be solved in two ways, either lower the latency of the structures in the backend so the resources the backend has can be freed up quicker or make the structures in the backend bigger to better absorb the amount of instructions coming from the frontend.
The three most common reasons for Zen 3 to stall out on the backend are the ROB filling, the Load Queue filling, and the Store Queue fill, with an honorary mention of the Floating Point Registers being the second most common reason for stalls in our testing of Linpack. So AMD making these structures larger and/or lower latency in Zen 4 is a likely possibility.
And lastly a larger L1 and L2 cache may also come with Zen 4 because the less time you spend trying to access data the more time you can spend working on data.
Appendix and Acknowledgments
I would like to thank our author and editor Clamchowder for both making the software I used to measure and record all our data and for helping me with both understanding and explaining the more technical details of CPUs like what is Dynamic Indirect Prediction.
I would also like to thank Fritzchens Fritz for his die shot of a Zen 3 CCD.
And without further adieu, here is that data I promised in the beginning of the article: https://drive.google.com/file/d/1bKD2lhfiMGlitNiC5f6nqw9Y9vpOfKCD/view?usp=sharing