How Zen 2’s Op Cache Affects Performance
Banner image credit goes to Fritzchens Fritz and his amazing die shots
Recent AMD and Intel high performance CPUs implement an op cache that remembers decoder output and functions like a L0 instruction cache. Compared to the traditional L1i fetch and decode path, the op cache provides higher bandwidth while saving power by allowing the decoders to idle. Branch mispredict recovery is also faster if the corrected target comes from the op cache, thanks to decode latency getting taken out of the picture.
In this article, we’ll be looking at Zen 2 in detail. All modern high performance CPUs, like Zen 2, feature extensive performance monitoring facilities that let us gather op cache related metrics (among other things) and thanks to the Twitterverse we now have a way to disable the op cache, giving us a cool opportunity to see test its performance and power impact.
Op Cache Hitrates
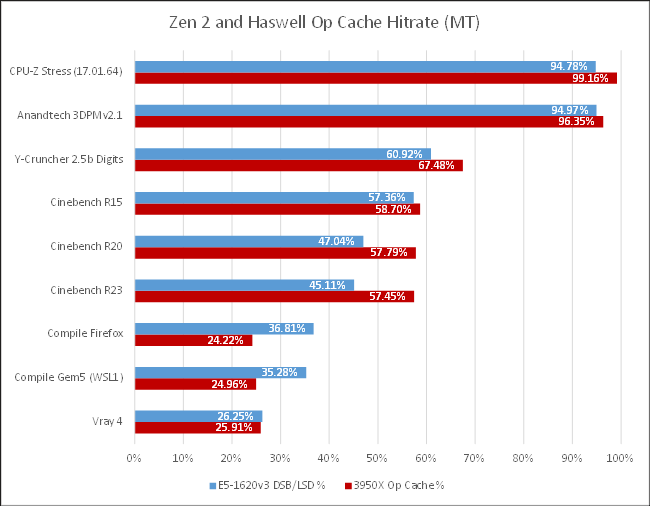
First, let’s look at how often the op cache feeds the core. Data collected from an Intel CPU is presented here too as a point of comparison.
In HC23 slides on Sandy Bridge, Intel claimed a 80% hitrate for most applications. According to Anandtech and a few other tech sites, ARM aimed for a 85% hitrate when they added a 1.5k entry op cache to their Cortex-A77 core. I never found hitrate claims from AMD, besides Zen 2’s larger op cache obviously getting better hitrates than Zen 1’s. From my data, claims from both Intel and ARM seem extremely optimistic.
Micro-op cache hitrate varies wildly with application. Ian Cutress’s 3DPM v2.1 and CPU-Z’s built in benchmark have op cache hitrates over 90%, even when two SMT threads are competitively sharing a single core’s micro-op cache. Hitrates go down from there. Cinebench has a larger code footprint and sees 50-60% micro-op cache hitrate, with some code fetches going further and missing L2 as well.
Compilation workloads and Vray take that further. They have even worse op cache, L1i, and L2 code read hitrates. And they’re backend bound from L1D misses. Frontend bandwidth takes a back seat here, and workloads like code compilation or Vray really need bigger, faster L1/L2/L3 caches.
Disabling the Op Cache: Power and Performance Impact

In Cinebench and Ian Cutress’s 3DPM v2.1 benchmark, Zen 2’s micro-op cache boosts score by more than 10%. Even though the decoder could be shut off more than half the time (or almost all the time in 3DPM v2.1), power consumption still increased because the better-fed core was executing more instructions per cycle. That suggests decoder power draw is far lower than other core components.
Y-Cruncher’s performance gains are limited in comparison; even though op cache hitrate was almost 70%, the performance boost is limited because the cores spend a lot of time waiting for data. Once more, Vray 4 and code compilation take this further and frontend bandwidth is overshadowed by other factors. With just a few percentage points of performance difference, a user probably wouldn’t notice if the op cache was off.
Finally, CPU-Z’s benchmark is weird; it fits within L1 caches, yet per-thread IPC at 1.34 which isn’t particularly high. In terms of thread cycles, the top dispatch stall reasons are running out of FP registers (7%), a full reorder bufer (4%), a full FP scheduler (1.31%), and miscellaneous integer scheduler resource stalls (1.31%) which points to floating point execution latency being the primary bottleneck.
Estimating Decoder Power
In most applications, it’s hard to isolate decoder power because the micro-op cache hitrate isn’t close to 100%. Furthermore, the micro-op cache keeps the backend better fed, meaning the execution units consume more power.
That’s where CPU-Z’s benchmark comes in. In single threaded mode, the score is identical regardless of whether the micro-op cache is enabled, even with a >99% micro-op cache hitrate. That lets us go between completely using the op cache, or completely using the decoders, and compare power draw without noise from different utilization of other core components.
From the core power counter, the decoders draw about 0.24 W, or just under 4% of core power. The situation is muddier with package power. With a single thread load at 3.5 GHz, most of package power is not core power. But when looking at package power, the difference in power decreases to under 1%.
When CPU-Z is loading all threads, disabling the op cache causes power draw to increase by 0.375 W per core. But that figure is an overestimate of decoder power, since the benchmark score increased by around 1% with the op cache enabled.
Closing Remarks
AMD did a good job with Zen 2’s op cache. It can boost performance by more than 10% while always providing a power efficiency win. ARM and Intel’s situation is probably similar, though their smaller op caches may have slightly less of an impact. It’s no surprise that AMD, ARM, and Intel have all chosen to implement micro-op caches.
Appendix: Extended Analysis, More Data
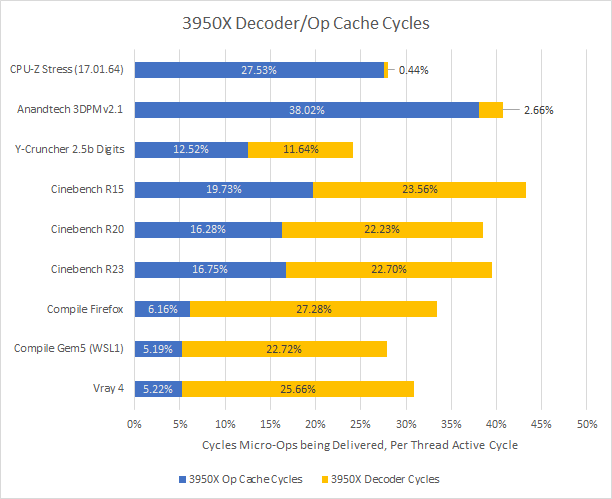
To dive deeper, let’s look at how often the core is fed from the op cache or decoders. This metric is different from hitrate, as it accounts for the lower bandwidth from decoders as well as time when both paths were idle (for example, from an instruction cache miss or waiting for the core to clear out pending instructions).
Assuming an all-thread load, the closer the total gets to 50% (remember there are two SMT threads per core), the more likely you are to be bottlenecked by how fast the decoder/micro-op cache can bring instructions into the core. That said, some phases of the compilation workloads didn’t load all threads. For those workloads though, the frontend wasn’t close to 50% busy and is unlikely to be a bottleneck.

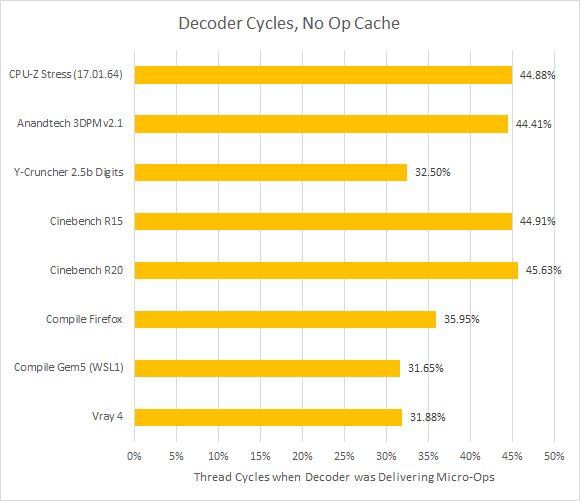
When the decoder is forced to handle everything, its utilization goes up across the board. CPU-Z, 3DPM, and Cinebench now see a very busy frontend. Other workloads see more decoder idle time, though the decoder is still active more often than not (at least if compilation is excluded).
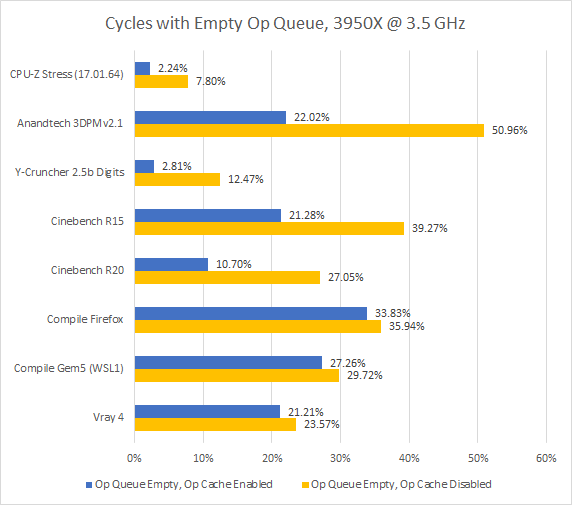
Zen 2’s op cache and decoders actually feed a queue in front of the backend, called the op queue here for short. While an empty op queue doesn’t necessarily mean a frontend bottleneck, it’s another metric that shows the op cache’s benefits.
Ian Cutress’s 3DPM v2.1 stands out by destroying Zen 2’s otherwise impressive branch predictor. With 88.5% branch prediction accuracy and 13.24 branch MPKI, the op cache’s lower latency really comes into play. Higher bandwidth from the op cache helps catch up after a branch mispredict too. That explains 3DPM’s 11.4% score improvement from enabling the op cache.
Cinebench R15 also suffers from branch mispredicts, though its situation is less severe. Zen 2 gets around 96% accuracy here, with 5.15 branch MPKI. Still, Cinebench R15 pushes frontend bandwidth a bit more because it achieves higher IPC than 3DPM. Just for reference, I’ve put IPC data below.

Test Setup
All tests were run on a 3950X, unless otherwise indicated. We used event 0xAA, or “Uops Dispatched from Decoder” to count micro-ops coming from the decoder (unit mask 0x1) or op cache (unit mask 0x2). We got cycle counts for when the decoders or op cache were used by setting count mask = 1 on the appropriate event/unit mask.
As for disabling the op cache, the the Twitter thread specifically figured out that setting bit 5 of MSR 0xC0011021 disables the micro-op cache on Zen 1. I tested the same on Zen 2, and confirmed through performance counters that no micro-ops are delivered from the micro-op cache when that bit is set.
Because enabling or disabling the op cache affects core power draw, and MT loads are often power limited, core performance boost was disabled by setting bit 25 of MSR 0xC0010015 (Zen 2’s hardware configuration MSR). That prevents the CPU from boosting above its base frequency of 3.5 GHz.
Intel’s op cache hitrates are slightly more complex to calculate, as the pipeline can be fed from the decoders (MITE), op cache (DSB), microcode sequencer (MS), or loop buffer (LSD). For the graph in this article, I counted LSD hits as op cache hits for a more apples-to-apples comparison with AMD, as the loop buffer similarly provides high throughput and bypasses decoders. As an aside, the MS is counted as a separate source here because unlike AMD, Intel does not cache MS output in the op cache. Instead, the op cache stores a pointer to microcode, making the MS distinct from the decoders.
Performance impact was determined by difference in benchmark score, except for compilation workloads where the difference in measured IPC was used. Also, Cinebench R23 was not examined as extensively as other workloads because it’s very similar to R20.


