
GPU Memory Latency’s Impact, and Updated Test

In a previous article, we measured cache and memory latency on different GPUs. Before that, discussions on GPU performance have centered on compute and memory bandwidth. So, we’ll take a look at how cache and memory latency impact GPU performance in a graphics workload.
We’ve also improved the latency test to make it more accurate, and expanded it to test different types of memory. That’ll be covered further down.
Evaluating Latency’s Impact
GPUs have headline grabbing compute and memory bandwidth specs, but need tons of parallelism to utilize that. Unlike CPUs that do out of order execution (moving past an instruction waiting on cache/memory latency), GPUs simply try to find another thread that’s ready to execute when one gets stuck waiting. Without enough threads, a GPU will become latency bound and unable to max out its compute or bandwidth capability. Here, we’ll dissect a graphics workload, and have a look at how well Ampere and Pascal are able to utilize their GPU resources with the parallelism available in a (very big) graphics workload.
We ran the Ungine Superposition benchmark at the “8K Optimized” preset, and used Nvidia Nsight to collect performance metrics. Superposition was chosen because it’s a very GPU-bound workload that’s relatively easy to take frame captures on. At the 8K optimized preset, it should provide a massive amount of parallelism, which should help especially with huge GPUs like the RTX 3090. We ran the benchmark in game mode and captured the starting view to keep results consistent, since there’s a delay in Nsight frame capture that makes it extremely difficult to capture similar frames in a running benchmark.
First, let’s look at how much throughput utilization metrics for various GPU components. Speed of Light, or SOL, is Nvidia’s term for how much theoretical throughput was utilized. For example, if VRAM SOL is 50%, then 50% of VRAM bandwidth was used.
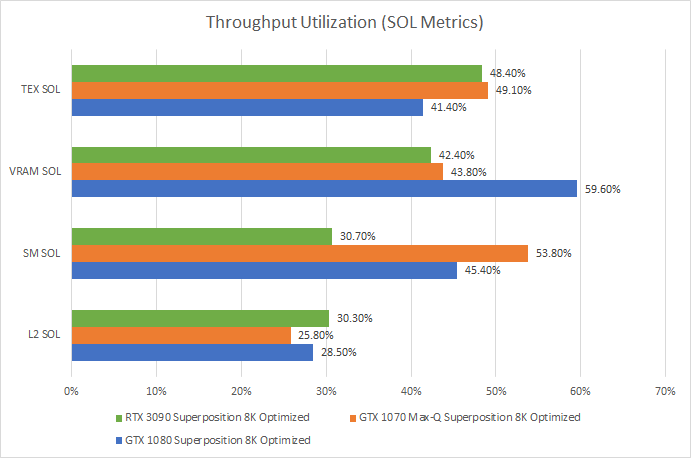
If the top SOL is under 60%, Nvidia considers that unit under-utilized or running inefficiently. And because every other unit has even lower utilization than the most-utilized unit, the whole GPU is under-utilized. Compared to the RTX 3090, the GTX 1080 has higher VRAM bandwidth utilization – just under the 60% threshold. Pascal also achieves better shader (SM) utilization, while Ampere sees more texture pipeline usage. With a smaller shader array and lower clocks, the GTX 1070 Max-Q sees the best shader throughput utilization at 53.8%. But all cards are far from being bandwidth or compute throughput bound.
To understand this low utilization, we can analyze warp stall reasons to see what the shader execution units were waiting on. “Warp” is Nvidia’s term for a group of 32 operations that mostly execute in lockstep, and is analogous to a CPU thread. Lots of stalled warps are expected and not necessarily bad. Remember, a GPU keeps its execution units fed by tracking a ton of warps and hoping enough are un-stalled to keep the execution units busy. For example, each Pascal SM can track up to 64 warps. In CPU terms, a Pascal SM is an in-order core with 64-way SMT and four 1024-bit wide vector execution units. Ampere is similar, but with 48-way SMT. When occupancy is higher (more of those “SMT threads” are active), the SM has a better chance of hiding latency by finding an un-stalled “SMT thread”.
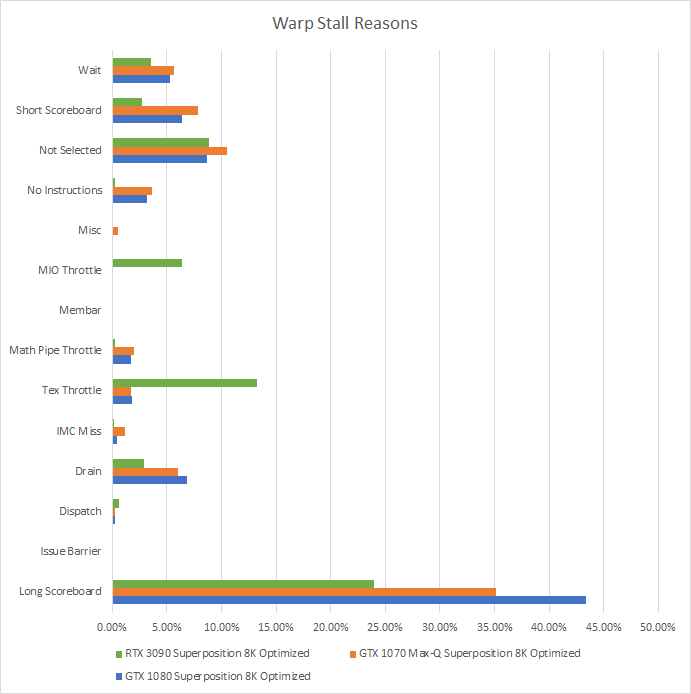
Nvidia’s stall reasons aren’t the most intuitive, so Kernel Profiling Guide :: Nsight Compute Documentation (nvidia.com) is a good read. For brevity we’ll be focusing on the top stall reason – “Long Scoreboard”. “Long Scoreboard” means the warp is waiting for data from cache or VRAM (latency bound). By itself, long scoreboard could also mean we’re approaching bandwidth limits because running out of bandwidth means a sharp increase in latency. However, low cache and memory bandwidth utilization on both GPUs points to latency being more of a factor. We can also check Nvidia’s guidance:
If “sm__issue_active_per_active_cycle_sol_pct” is lower than 80% and “smsp__warp_stall_long_scoreboard_pct” is the top warp-stall reason, then you know that the shader is TEX-latency limited.
Loosely translated, Nvidia is saying that if the shaders are using less than 80% of their issue bandwidth while they have work to do, and the top stall reason is because warps were waiting on cache/memory, then you’re limited by cache/memory latency.
Long scoreboard is clearly the top stall reason on both GPUs. On Pascal, sm__issue_active_per_active_cycle_sol_pct is 52%. We didn’t get this metric on Ampere, but the metric name roughly reads “how much shader issue bandwidth was in use, as a percentage of SM active cycles”. Ampere’s SMs were active 79.97% of the time, and 30.7% of SM throughput was utilized. That should put sm__issue_active_per_active_cycle_sol_pct at around 38.3%. That’s also way under Nvidia’s 80% threshold. Thus, Superposition even at the 8K optimized preset is primarily limited by memory latency on both GPUs.
Finally, to understand Pascal’s better throughput per-SM despite suffering more long scoreboard stalls, we’ll look at occupancy.
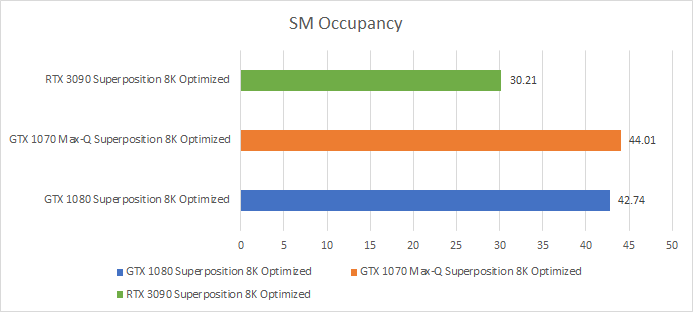
If you could see SMs as cores in Task Manager, the GTX 1080 would show up with 20 cores and 1280 threads. If you looked at overall utilization, you’d see about 56.9% overall utilization (66.7% occupancy * 85.32% average SM active time). The RTX 3090 would bring in a staggering 82 cores and 3936 threads, but only show 50.1% utilization (62.7% occupancy * 79.9% SM active time).
With more work queued up per-SM, Pascal has a better chance of finding something to feed its execution units with while waiting on memory. Of course, Ampere has some architecture tricks up its sleeve. Since Turing, Nvidia can handle L1 misses out-of-order, helping reduce long scoreboard stalls. Ampere also features larger instruction caches and lower execution latency, reducing stalls under the “No Instructions” and “Wait” categories respectively. But despite Ampere’s updated architecture, it still can’t utilize its shaders as efficiently as Pascal.
On top of that, Nsight tells us there’s a 5.61% SM active min/max delta for the RTX 3090, but only 0.71% on the GTX 1080. That suggests load isn’t being evenly distributed across Ampere’s giant shader array, meaning some SMs finished their work first and had to idle waiting for others to finish.
Updated Test, Updated Results, More Results
The first version of the latency test used a fixed stride access pattern. After testing across several GPUs, none of them did any prefetching, so any jump greater than the burst read size would be sufficient to hit memory latency. This works very well on Nvidia, but not AMD. AMD might have a different cache replacement policy that gives high cache hitrates even after the region size exceeds the cache size. To counter this, we switched to a random access pattern using Sattolo’s Algorithm. Credit goes to dragontamer5788 on TPU forums for mentioning this.
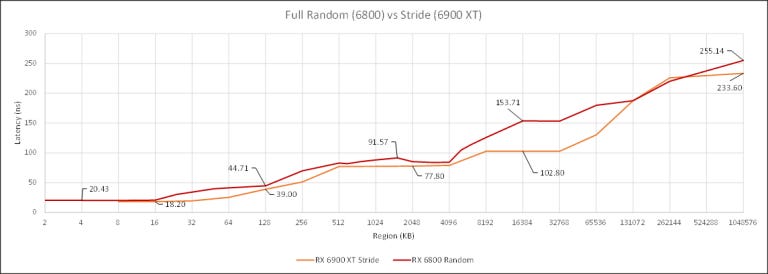

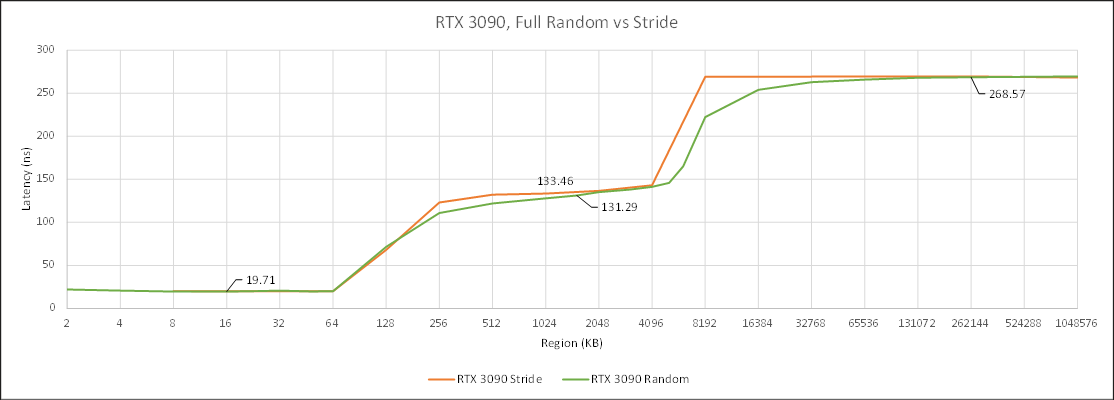
Nvidia’s results don’t change much. In fact, the fixed stride access pattern works a bit better with Nvidia and shows cleaner breaks when cache sizes are exceeded. But AMD is different, especially with RDNA(2). The cache hierarchy is more visible with the random access pattern. So going forward, we’re going to be using a random access pattern rather than a fixed stride to avoid underestimating AMD’s cache latency.
We’ll also be unrolling the test loop by a factor of 10. That should reduce loop overhead when the compiler doesn’t do the unrolling for us. It doesn’t make a difference for Nvidia, but lowers latency for AMD. Maybe Nvidia’s able to hide branch overhead with latency. Or maybe the compiler is unrolling the loop behind the scenes. Either way, using an unrolled loop should give more accurate figures for AMD and avoids overestimating latency there.
Revisiting AMD and Nvidia’s Latest and Greatest
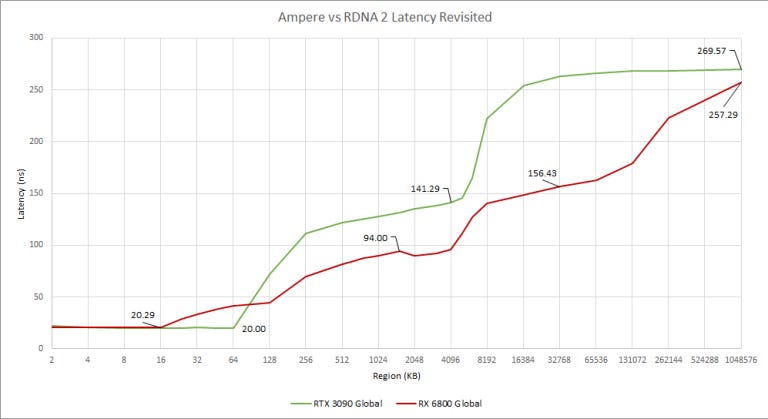
With the newer test, RDNA 2 and Ampere have similar latency to their fastest cache, but Ampere’s L1 is larger than RDNA 2’s L0. Nvidia can also change their L1 and shared memory allocation to provide an even larger L1 size (up to 128 KB according to the GA102 whitepaper). But for OpenCL, it looks like Nvidia chose to allocate 64 KB as L1.
Past the first level cache, RDNA 2’s L1 and L2 offer lower latency than Ampere’s L2. Infinity Cache isn’t as low latency as we first thought. It looks to have around 156 ns latency, making it about 15 ns farther away than Ampere’s L2. It still does quite well for such a large cache, and should provide benefits beyond preventing a VRAM bandwidth bottleneck. Requests served at lower latency from Infinity Cache will mean RDNA 2 doesn’t have to hide as much latency.
Another Look Back at Nvidia
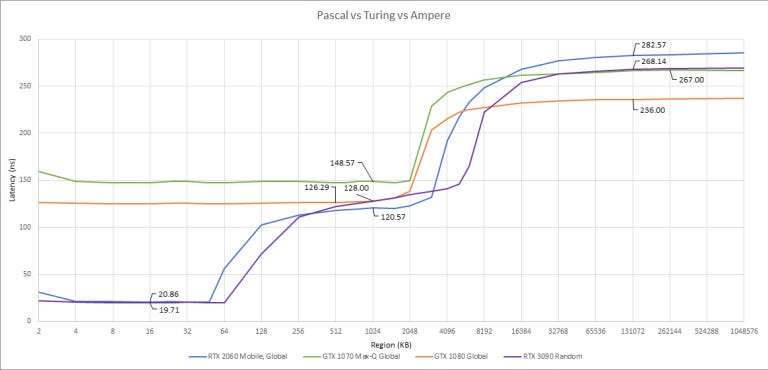
Turing and Ampere show similar patterns here, but curiously Turing’s GDDR6 has higher latency than Ampere’s GDDR6X. On Pascal, GDDR5X is faster to return data than GDDR5.
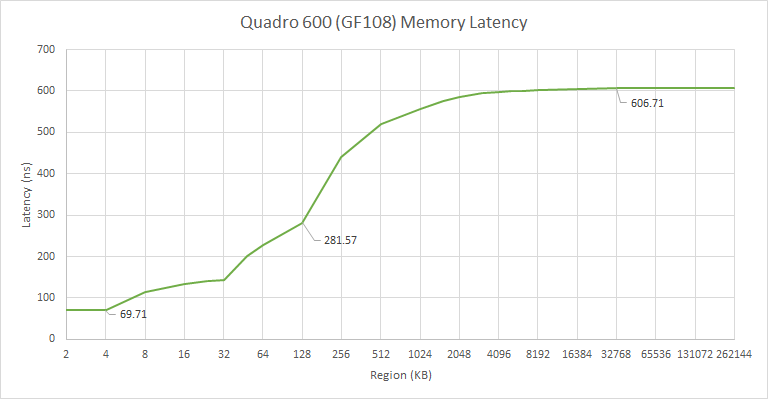
Again, Pascal’s L1 cache is not visible from OpenCL. We have to go all the way back to Fermi before the L1 is used again for compute applications.
Global vs Constant Memory on Nvidia
Unlike CPUs, GPUs have several types of memory. Global memory is similar to CPU memory. Code can read and write to global memory, and writes can be made visible to other SMs/CUs. Constant memory is read-only. Nvidia appears to use different caches to hold constant data. Testing with constant memory on AMD cards gives a latency plot very similar to that of global memory.
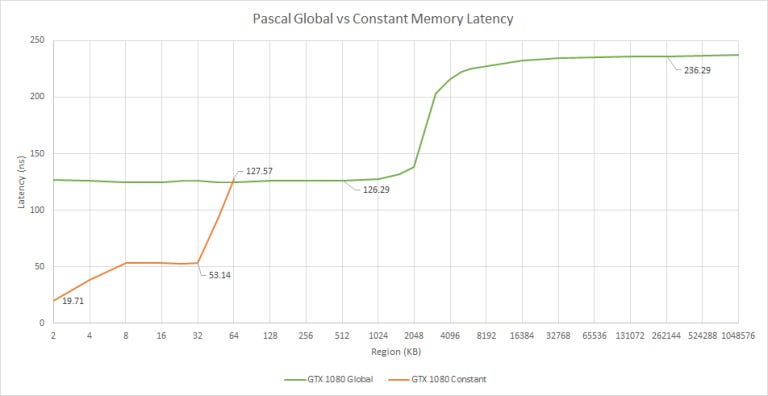
Our results for constant memory cache sizes line up with those presented in a paper where several Nvidia GPUs were microbenchmarked. Unlike global memory, Pascal caches constant memory in faster L1/L1.5 caches that are 2 KB and 32 KB in size, respectively. After 32 KB, constant data spills out to L2.
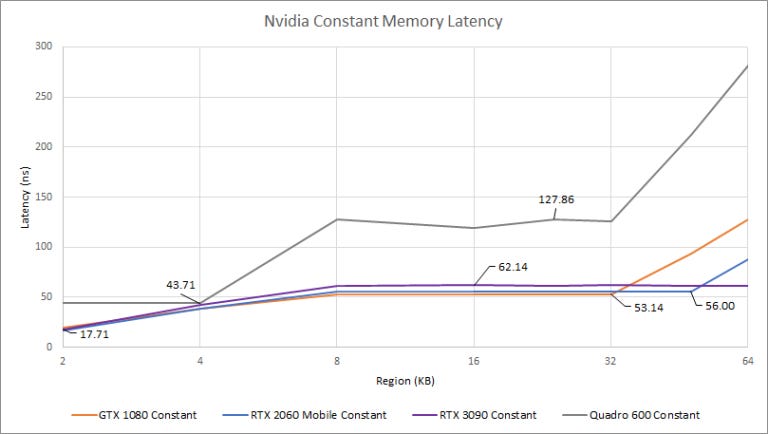
From our testing, all Nvidia GPUs have a fast 2 KB L1 constant cache, except for Fermi, where it’s 4 KB. Maybe it should be called a L0 cache, because it’s a touch faster than Ampere and Turing’s L1 caches.
If there’s more constant data, everything from Fermi to Pascal has a 32 KB L1.5 cache. Turing brings that cache’s size to 48 KB (Jia, Maggioni, Smith & Scarpazza’s paper says 46 KB, but it looks like 48 KB from our test), at a slight latency penalty. Ampere increases the L1.5 size to at least 64 KB, again increasing latency by a hair. It could be larger than 64 KB, but we can’t tell from our test because Nvidia only lets OpenCL programs allocate 64 KB of constant data.
A More Detailed Look at AMD’s Past
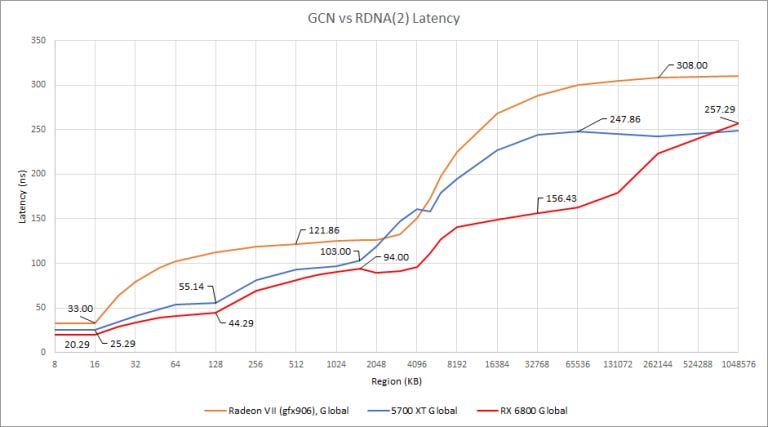
The GCN to RDNA transition brought more cache levels and lower latency across the board. Radeon VII, the last big GCN implementation for consumers, has a fast L1 and reasonably fast L2 (about on par with Pascal, Turing, and Ampere). But AMD brought latency even lower with RDNA. RDNA has a lot of design changes that aim to improve performance with low occupancy loads, and lowering cache/memory is right in line with that.
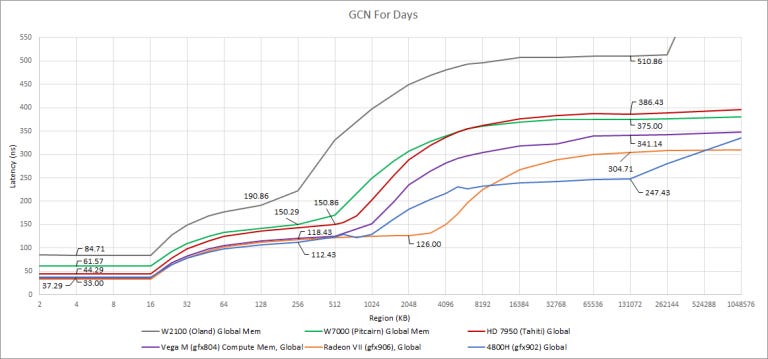
Since its debut about a decade ago, AMD has steadily augmented GCN with more cache and higher clockspeeds. Memory latency has come down partially because getting to L2 was faster, but latency between L2 and VRAM has been decreasing as well. The latest implementation of GCN in APU form has very low latency to main memory, though it probably benefits from a low latency memory controller designed to service latency sensitive CPU requests as well.
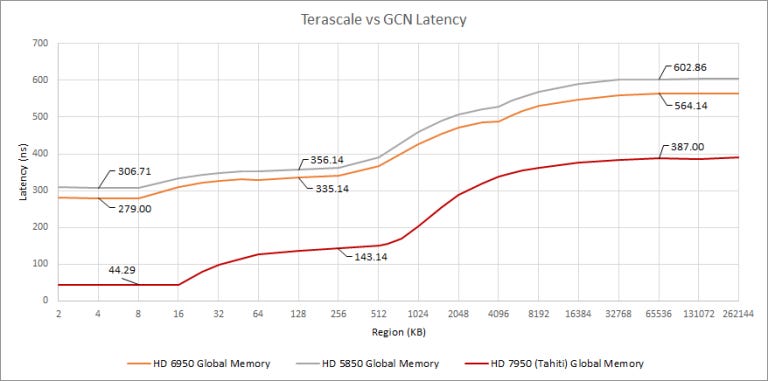
GCN bought massively lower load-to-use latency everywhere in the memory hierarchy. Curiously, Terascale’s L2 is only ~50 ns away from the L1, making it quite fast. Memory about 250 ns away from L2, which is in the same ballpark as GCN.
I suspect Terascale’s execution latency is partially to blame, because L1 latency is so high. Terascale worked a lot like GCN, using 16-wide SIMD units that could only complete a 64-wide wavefront instruction every four clocks. But Terascale could not issue ALU instructions from the same “thread” back-to-back due to register port conflicts, further increasing execution latency. Also, Terascale uses separate clauses for ALU and fetch (memory read) instructions. I couldn’t find concrete info, but there’s probably a clause switching penalty as state for a new clause is loaded.
Credits
Thanks to Cheese, Erok, JamesCJ, Sask, Sylvie, and Titanic for doing test runs on their cards, special thanks to Titanic for getting Nsight metrics on his RTX 3090, and credit to PCgamesN for the highlight photo.